re-analysis of the Commission on Community Interrelations experiments
Answering an Antisemitic Remark, 1945 to 1949
6 publications · 1,130 checks on the transcription · 47 data tables · 3 attitude experiments, 1946 · 7 preference rounds, 1945–1946 · 1 replication, 1949
These are re-analyses of the group averages and counts the authors published between 1950 and 1953. No individual questionnaire survives in the published record. Every number on this site traces to a table and page in the sources, and five scripts recheck the transcription against the printed totals.
What the studies did
From 1945 to 1949 the Commission on Community Interrelations of the American Jewish Congress staged short plays for audiences in New York and Newark, and once in Peoria, Illinois. In the main experiments, run in 1946, a man named Jones loses his turn in an employment-office waiting room to a man named Goldstein and says:
Another Jew who can't wait his turn. These Jews are all alike.
A bystander answers him. The answer either appealed to American values ("We don't want that kind of talk in America") or pointed to individual differences ("You find good and bad in every group"), and the actor delivered it either calmly or indignantly. Audience members filled in questions about Jews before and after the answer, and at the end said which of the two answers they had heard was better. On this site, "picked as the better answer" refers to that vote. Jewish audience members were left out of the analysis. In 1949 the same team ran the design with an anti-Black remark on a crowded subway, using calm answers only, with a white or a Black actor giving the answer.
Which answer audiences picked as the better one, and what followed
Against the antisemitic remark, the same audiences picked the two calm arguments as the better answer about equally often, but prejudice scores fell only after the American-values answer. Against the anti-Black remark, the two arguments were followed by about the same change. The difference between the two studies is 0.39 standard deviations (95% CI 0.06 to 0.72, p = .02).
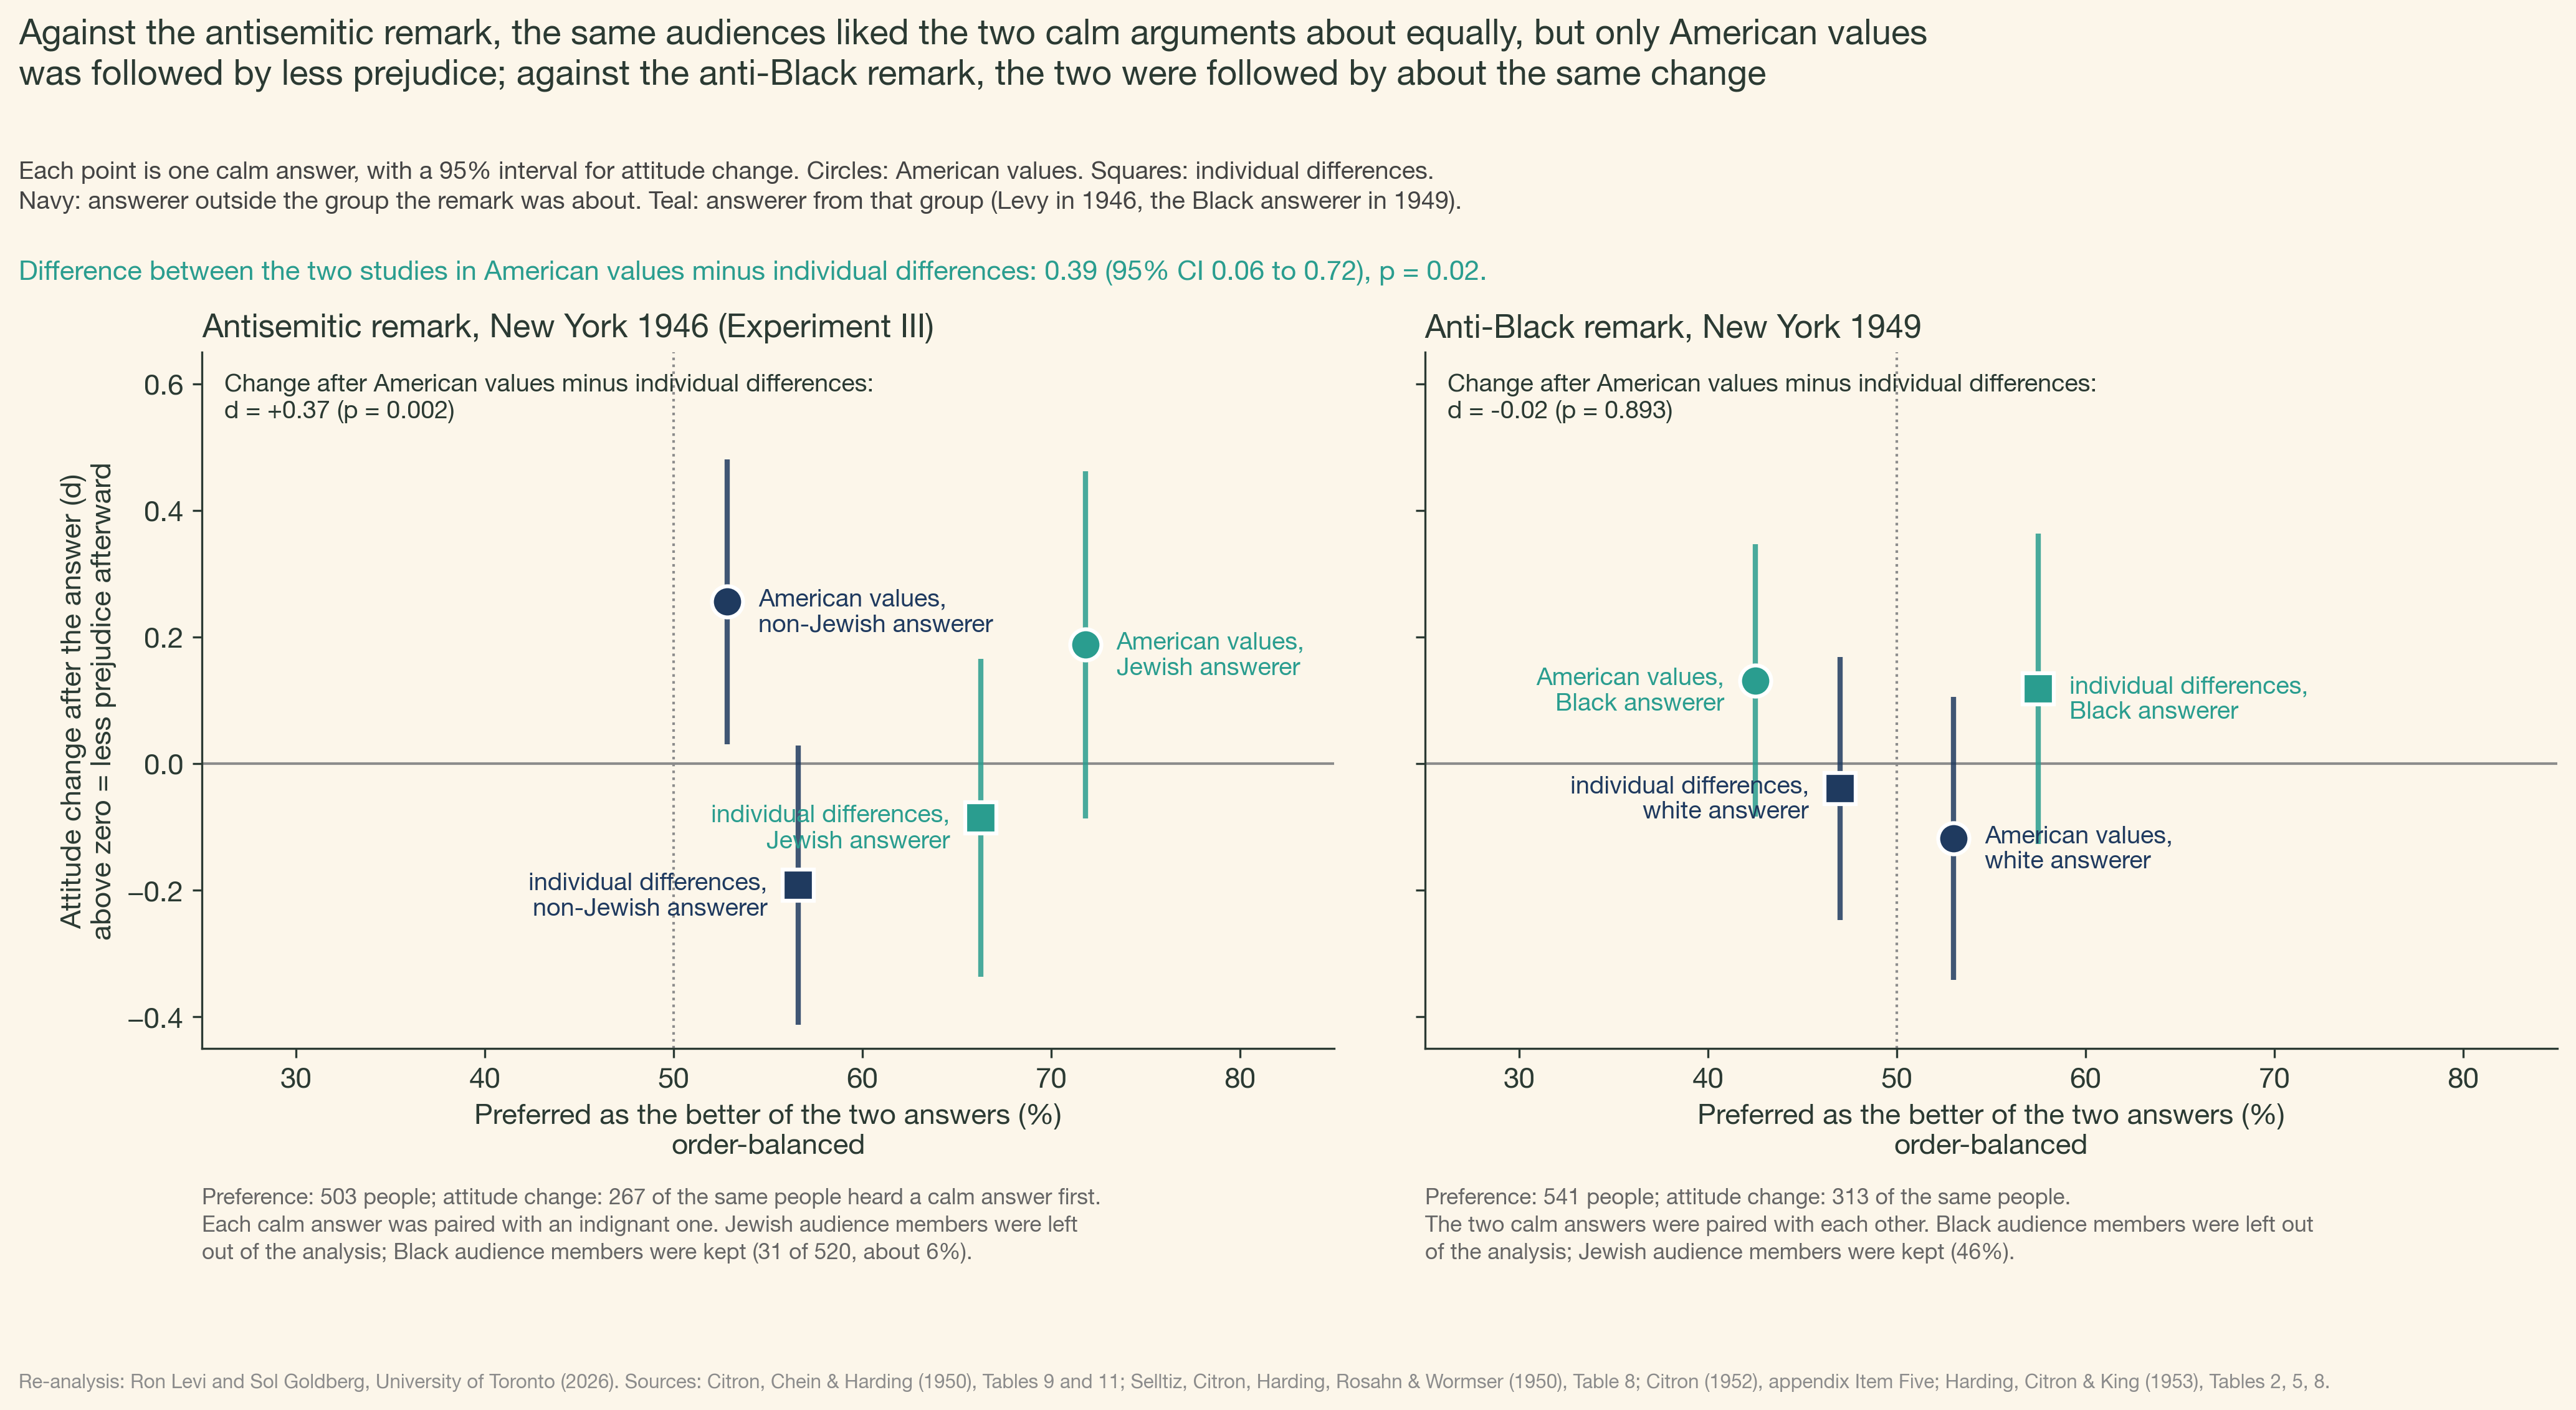
Each point is one calm answer heard by one set of audiences. Further right means more people chose it as the better answer; higher means prejudice scores fell more after it. The two years differ in what each calm answer was paired with: in 1946 an indignant answer, in 1949 the other calm answer, so the left-right positions are not comparable across the two panels. The next chart puts both years on one scale.
The studies differ in more than the remark: the year, the scripts, the setting, and who was in the audience (the 1946 analysis left out Jewish audience members and kept Black ones, about 6% in the largest experiment; the 1949 analysis left out Black audience members and kept Jewish ones, 46%). Any of these may contribute to the difference.
The gap between which answer was picked as better and which was followed by change bears on an early reply to the 1950 article. F. L. Marcuse showed the two calm answers to a Cornell class of 160 students; every student who gave an opinion judged individual differences the more effective answer, and Marcuse read this as not in agreement with Citron's result. In the 1946 audiences, which answer people preferred did not track which answer was followed by less prejudice, so a unanimous judgment of effectiveness and a measured change can come apart.
The same result on one scale
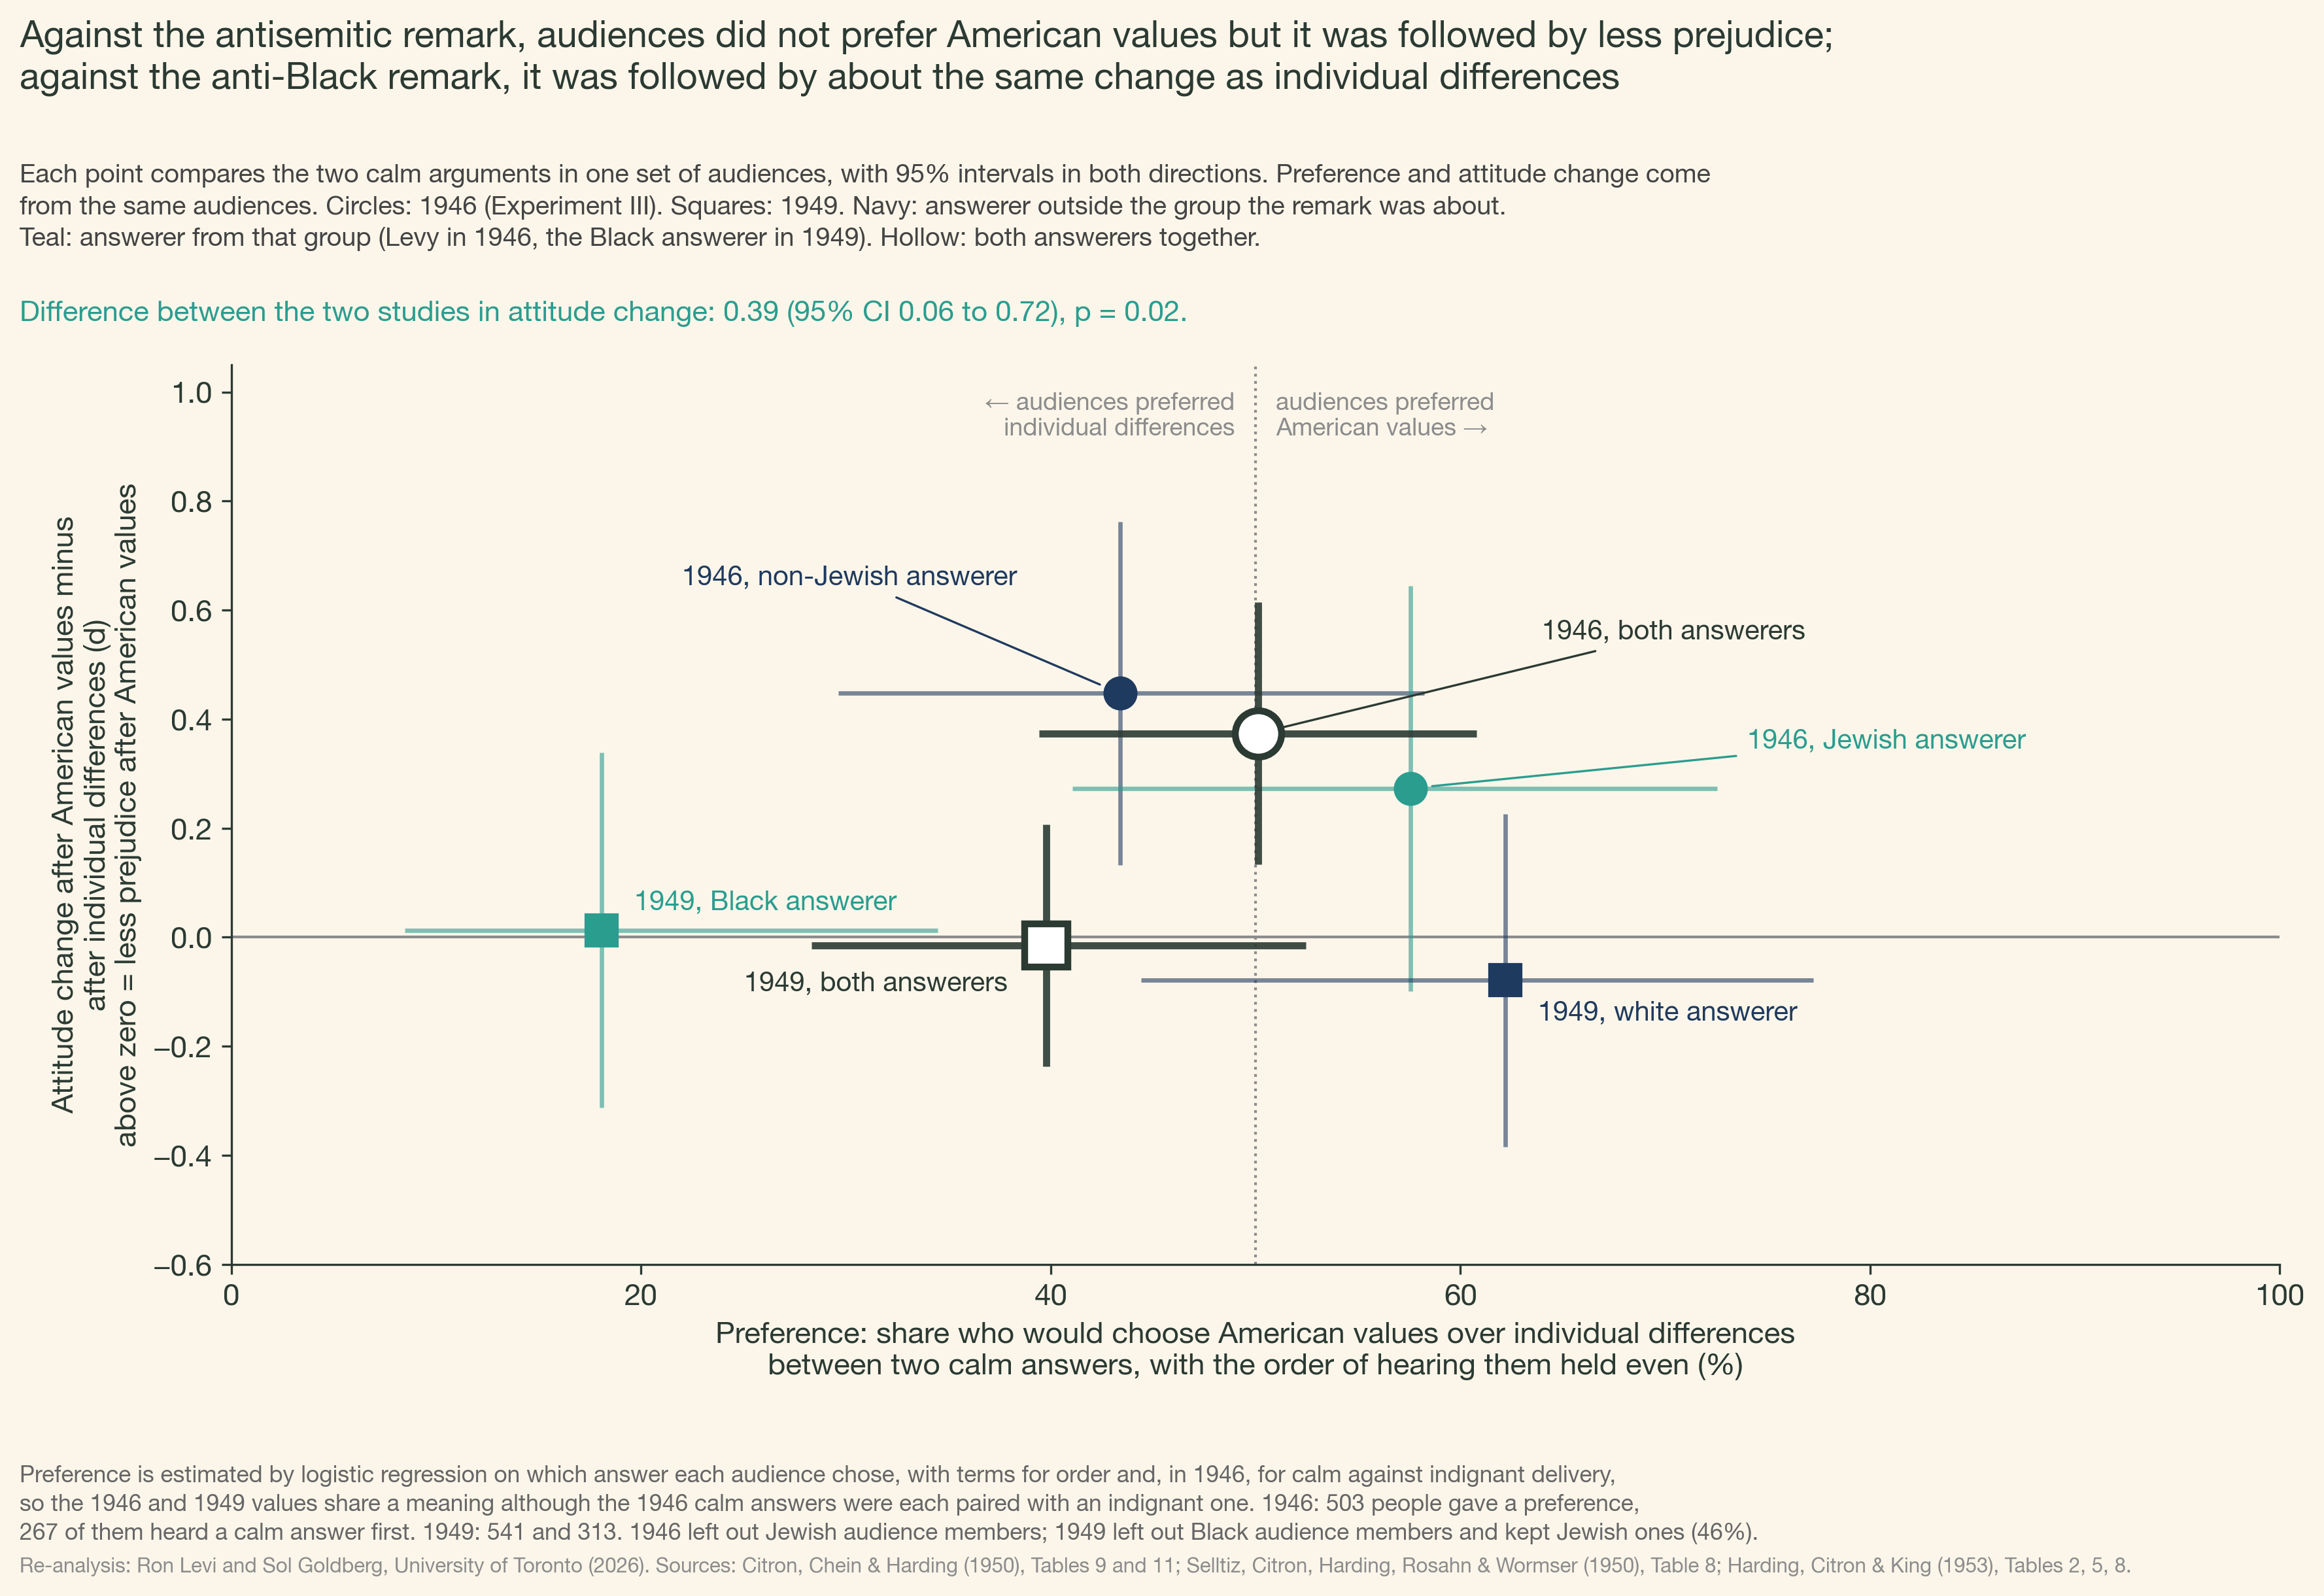
how to read this chart
- Each point stands for one set of audiences, for example the 1946 audiences who heard the non-Jewish actor. Circles are 1946 and squares are 1949. The two hollow points combine both actors in each year.
- Read the point left to right first. It shows whether those audiences picked the American-values answer as the better one more often than the individual-differences answer. The dotted line at 50% means they picked each equally often. Left of it, they leaned toward individual differences; right of it, toward American values.
- Then read it bottom to top. It shows whether prejudice fell more after the American-values answer than after the individual-differences answer. The line at zero means both answers were followed by the same change. Above zero, prejudice fell more after American values.
- The lines through each point are 95% intervals. A point whose vertical line stays clear of zero shows a difference in attitude change that chance alone would rarely produce.
- The hollow circle (1946) sits on the 50% line and well above zero: audiences picked each argument as the better answer equally often, yet prejudice fell more after American values. The hollow square (1949) sits near zero: the two arguments were followed by about the same change. The vertical distance between those two hollow points is the 0.39 difference reported above.
The left-right scale holds two things constant that otherwise drive the vote: most people chose whichever answer they heard second, and in 1946 most chose the calm answer over the indignant one. The estimate asks how the vote would split between two calm answers if neither had the advantage of coming second.
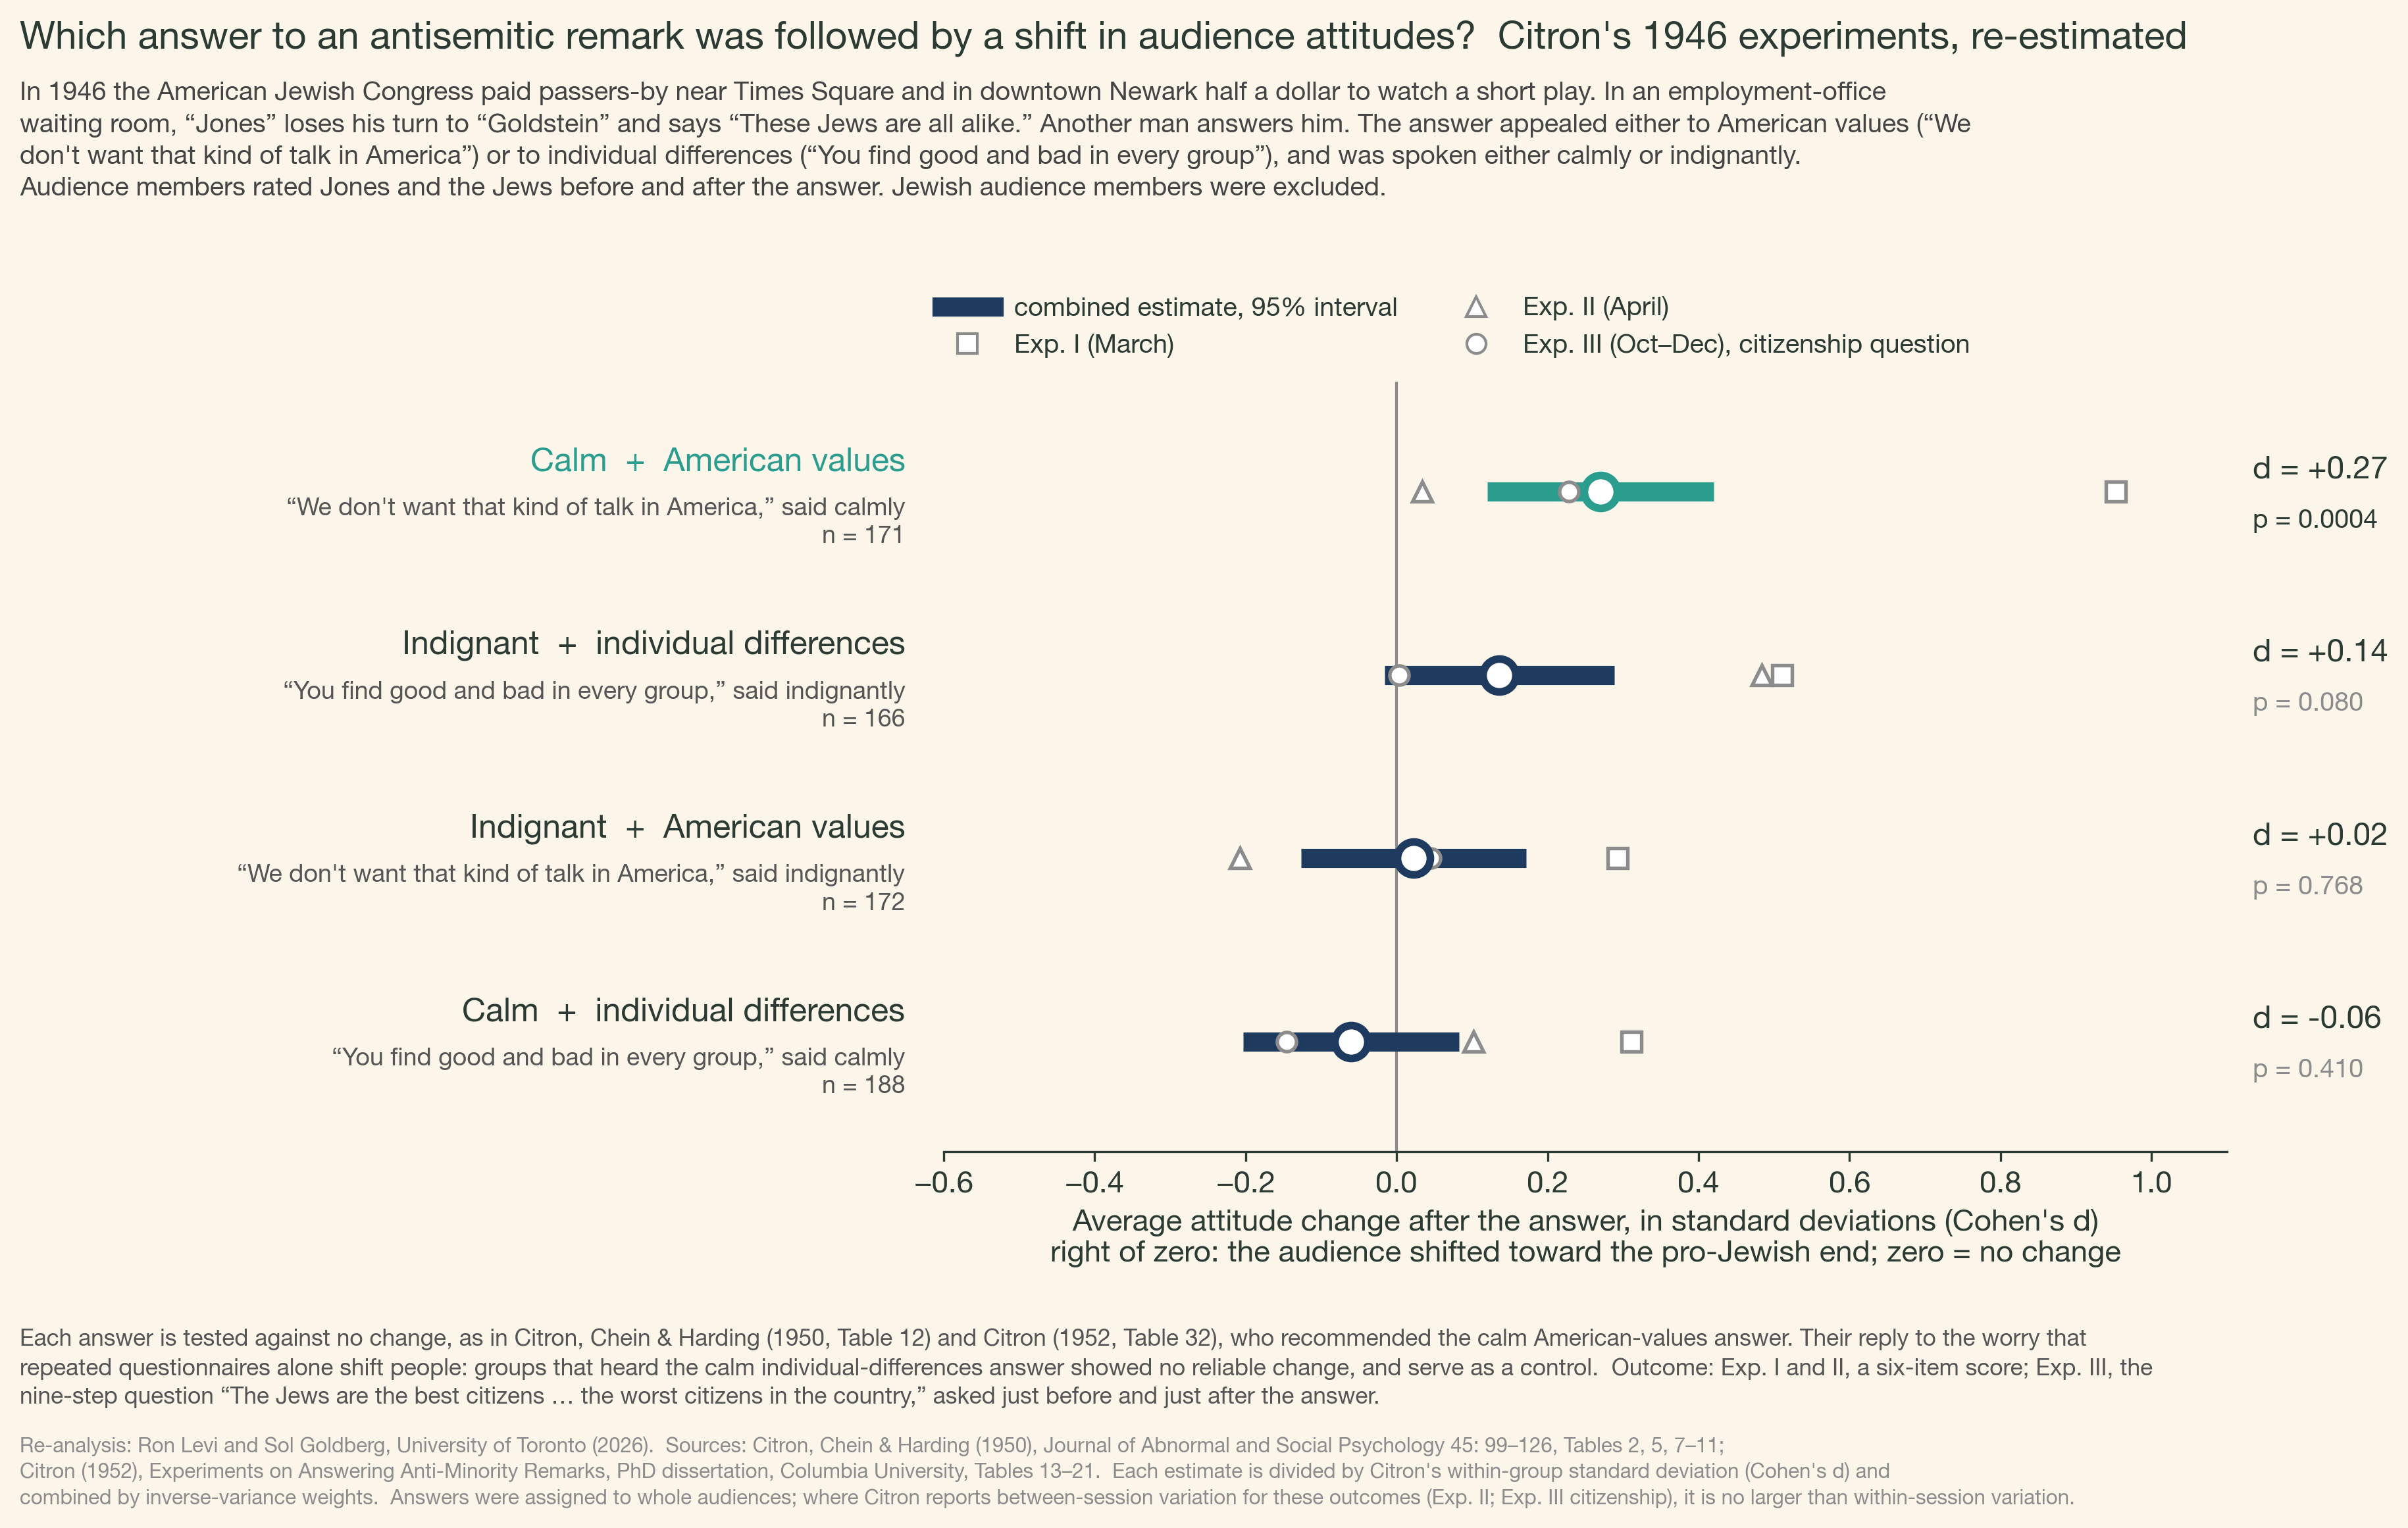
Each answer against no change, 1946
Across the three 1946 experiments, the calm American-values answer was followed by a shift toward the pro-Jewish end of the questions (d = +0.27, p = .0004, 171 people). None of the other three answers was followed by a reliable shift. The authors of the 1950 article drew the same conclusion from the same tables.
The same audiences heard two answers
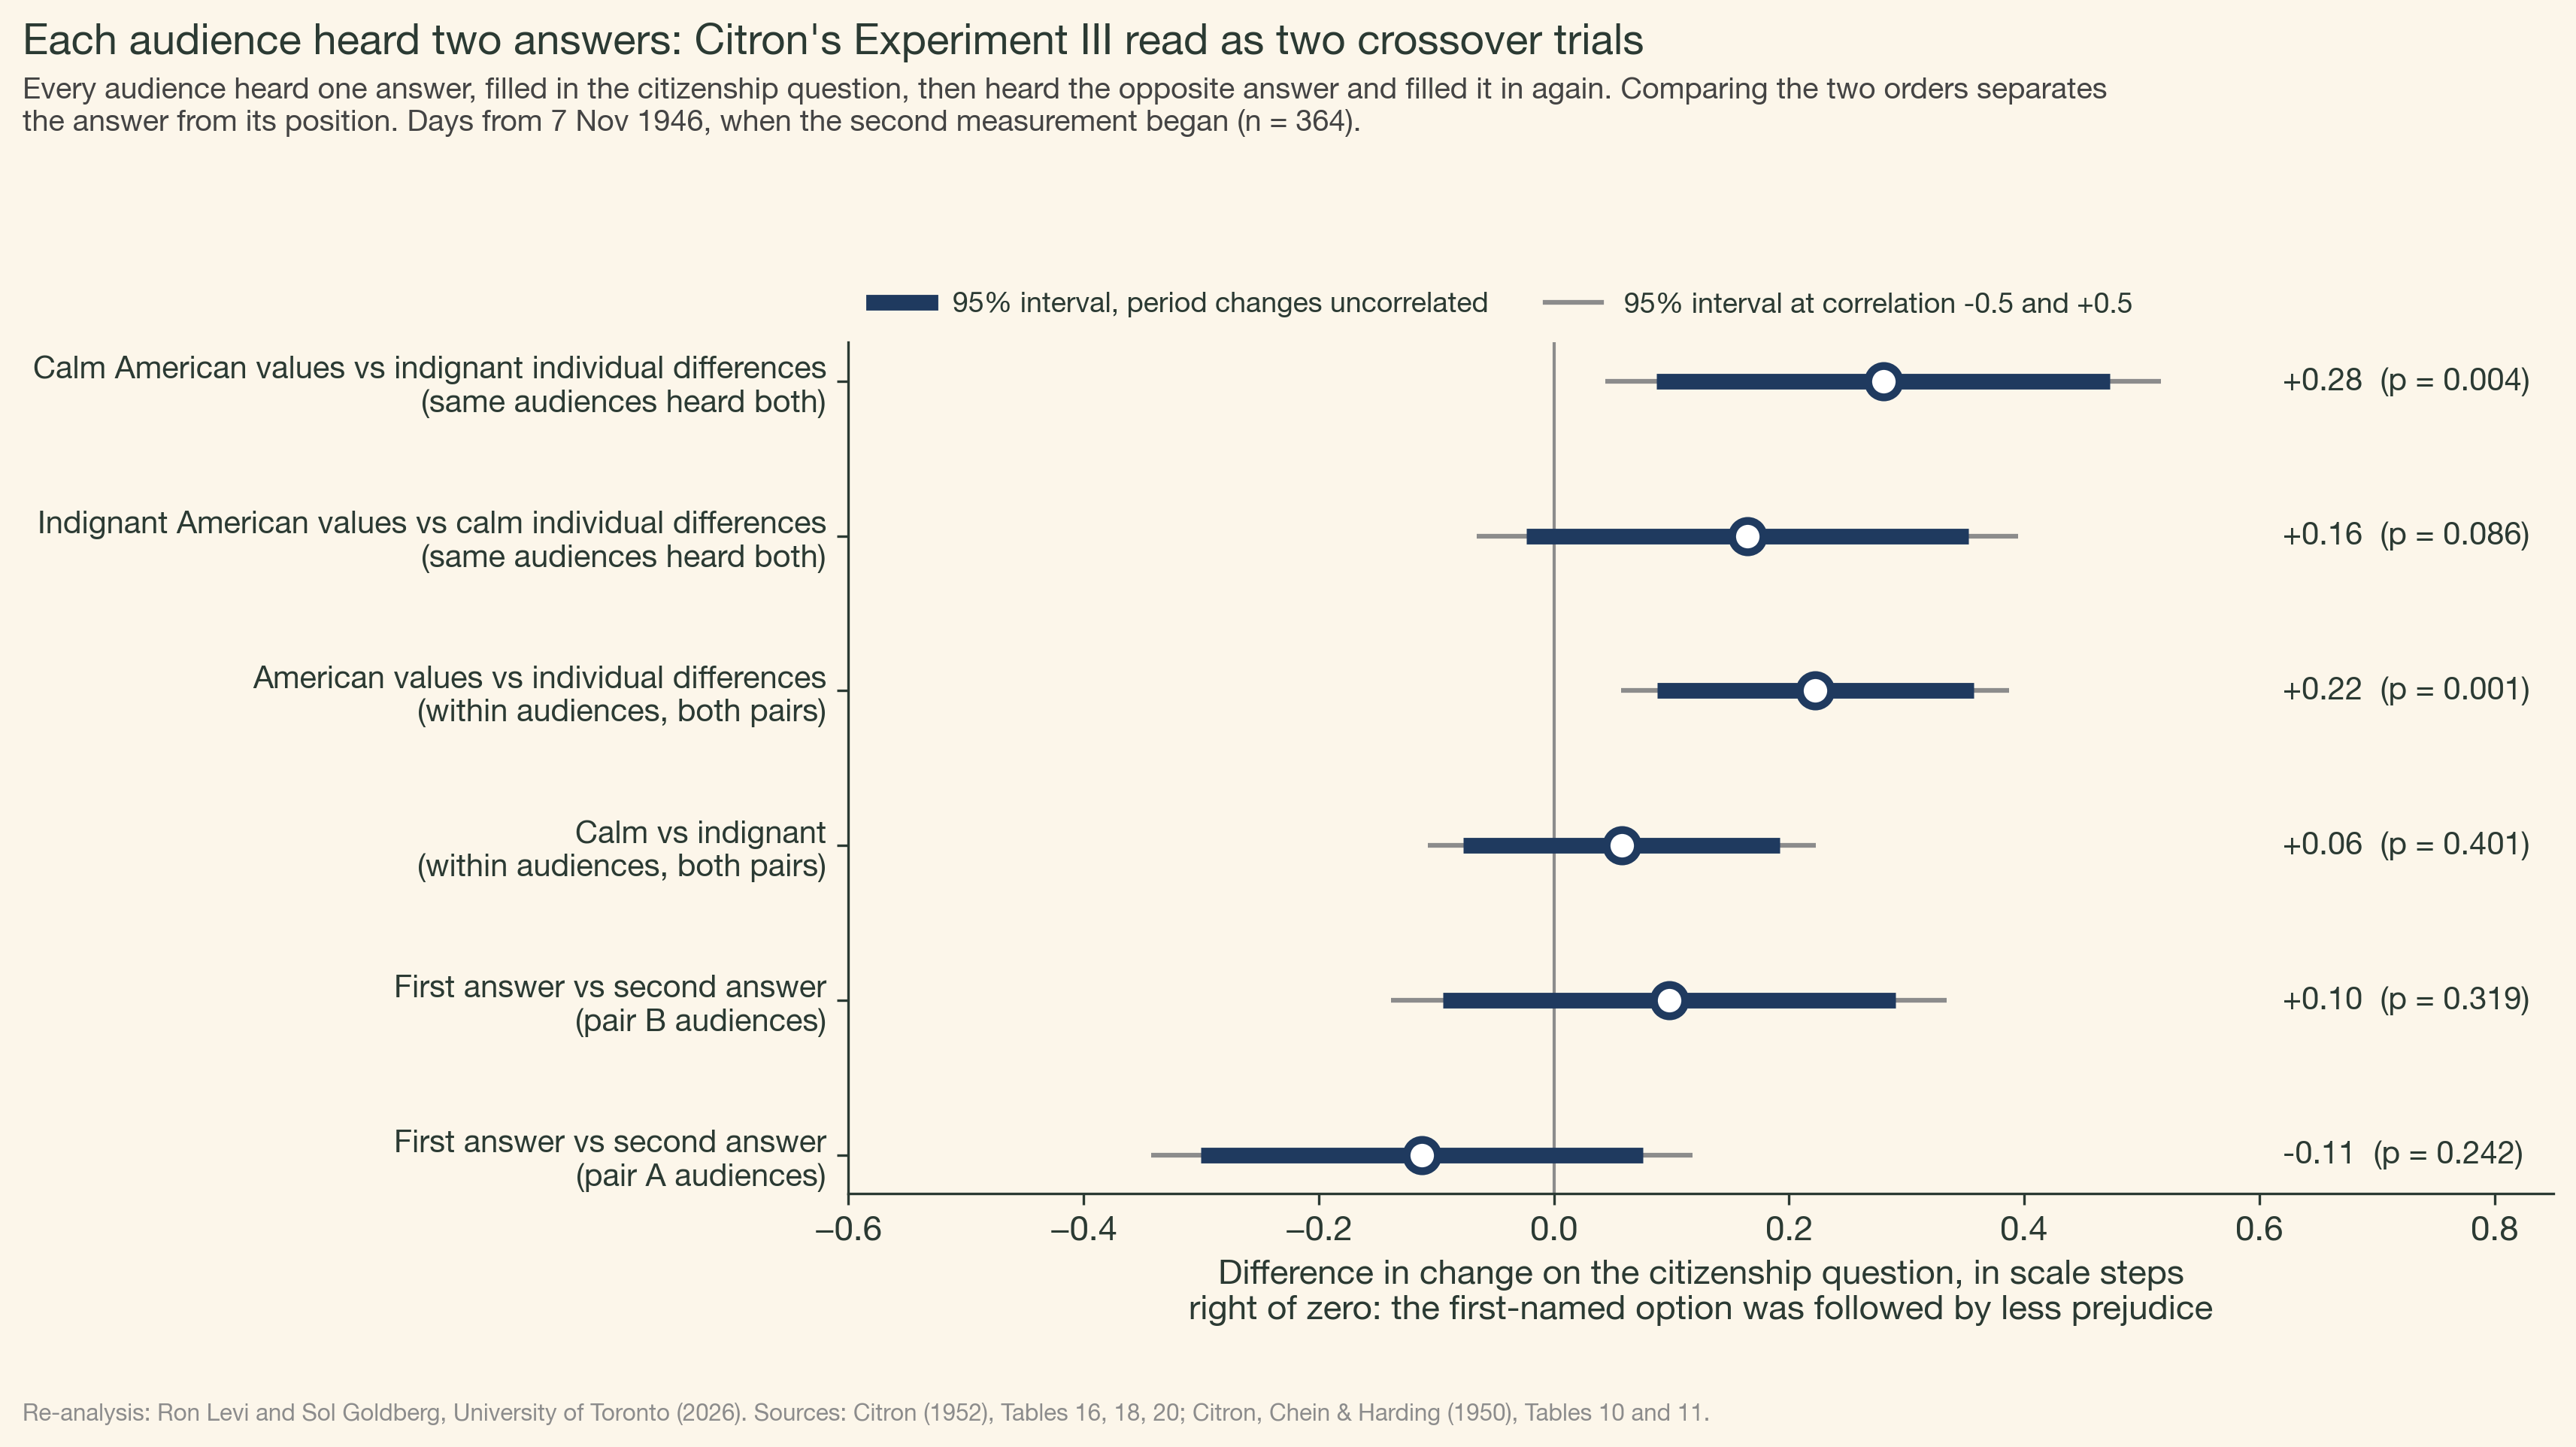
In Experiment III every audience heard one answer, filled in the citizenship question, then heard the opposite answer and filled it in again. Read as two crossover trials, this design compares each audience with itself. Within audiences, the American-values answer was followed by more change toward the pro-Jewish end than the individual-differences answer (+0.22 scale steps, p = .001). Calm and indignant delivery differed by less than chance would explain.
Argument, tone, and the pairing of the two
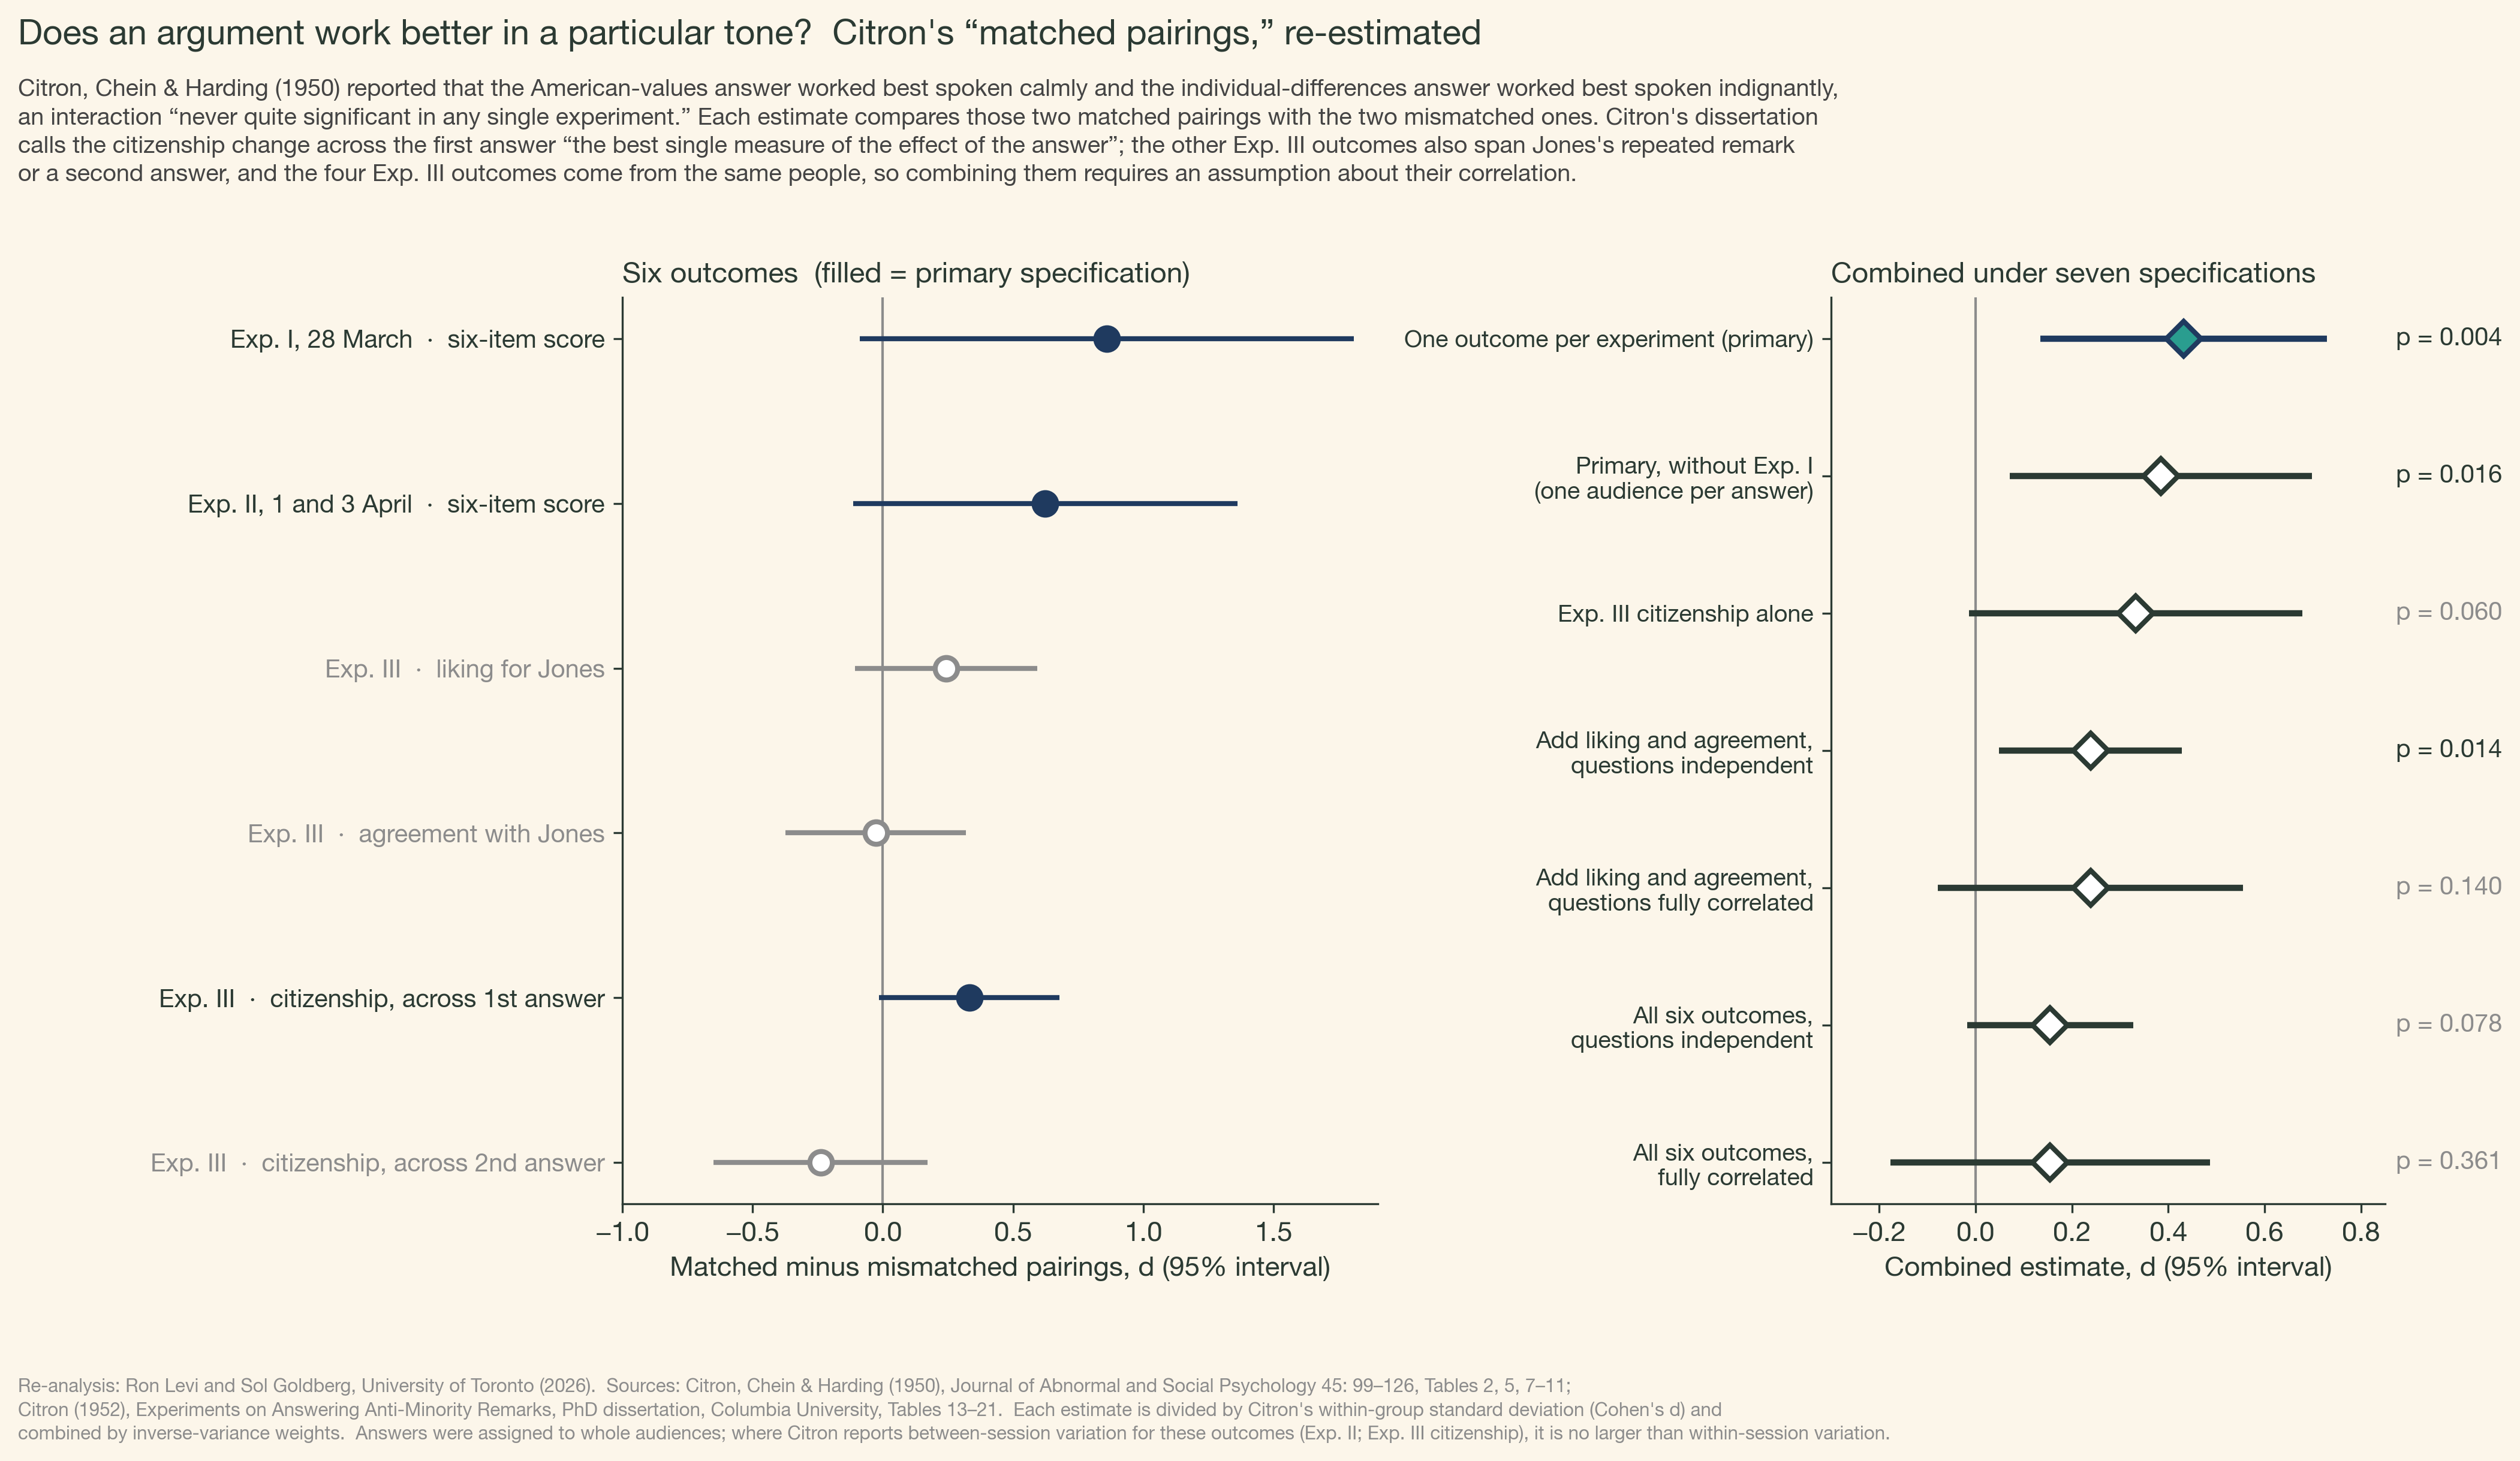
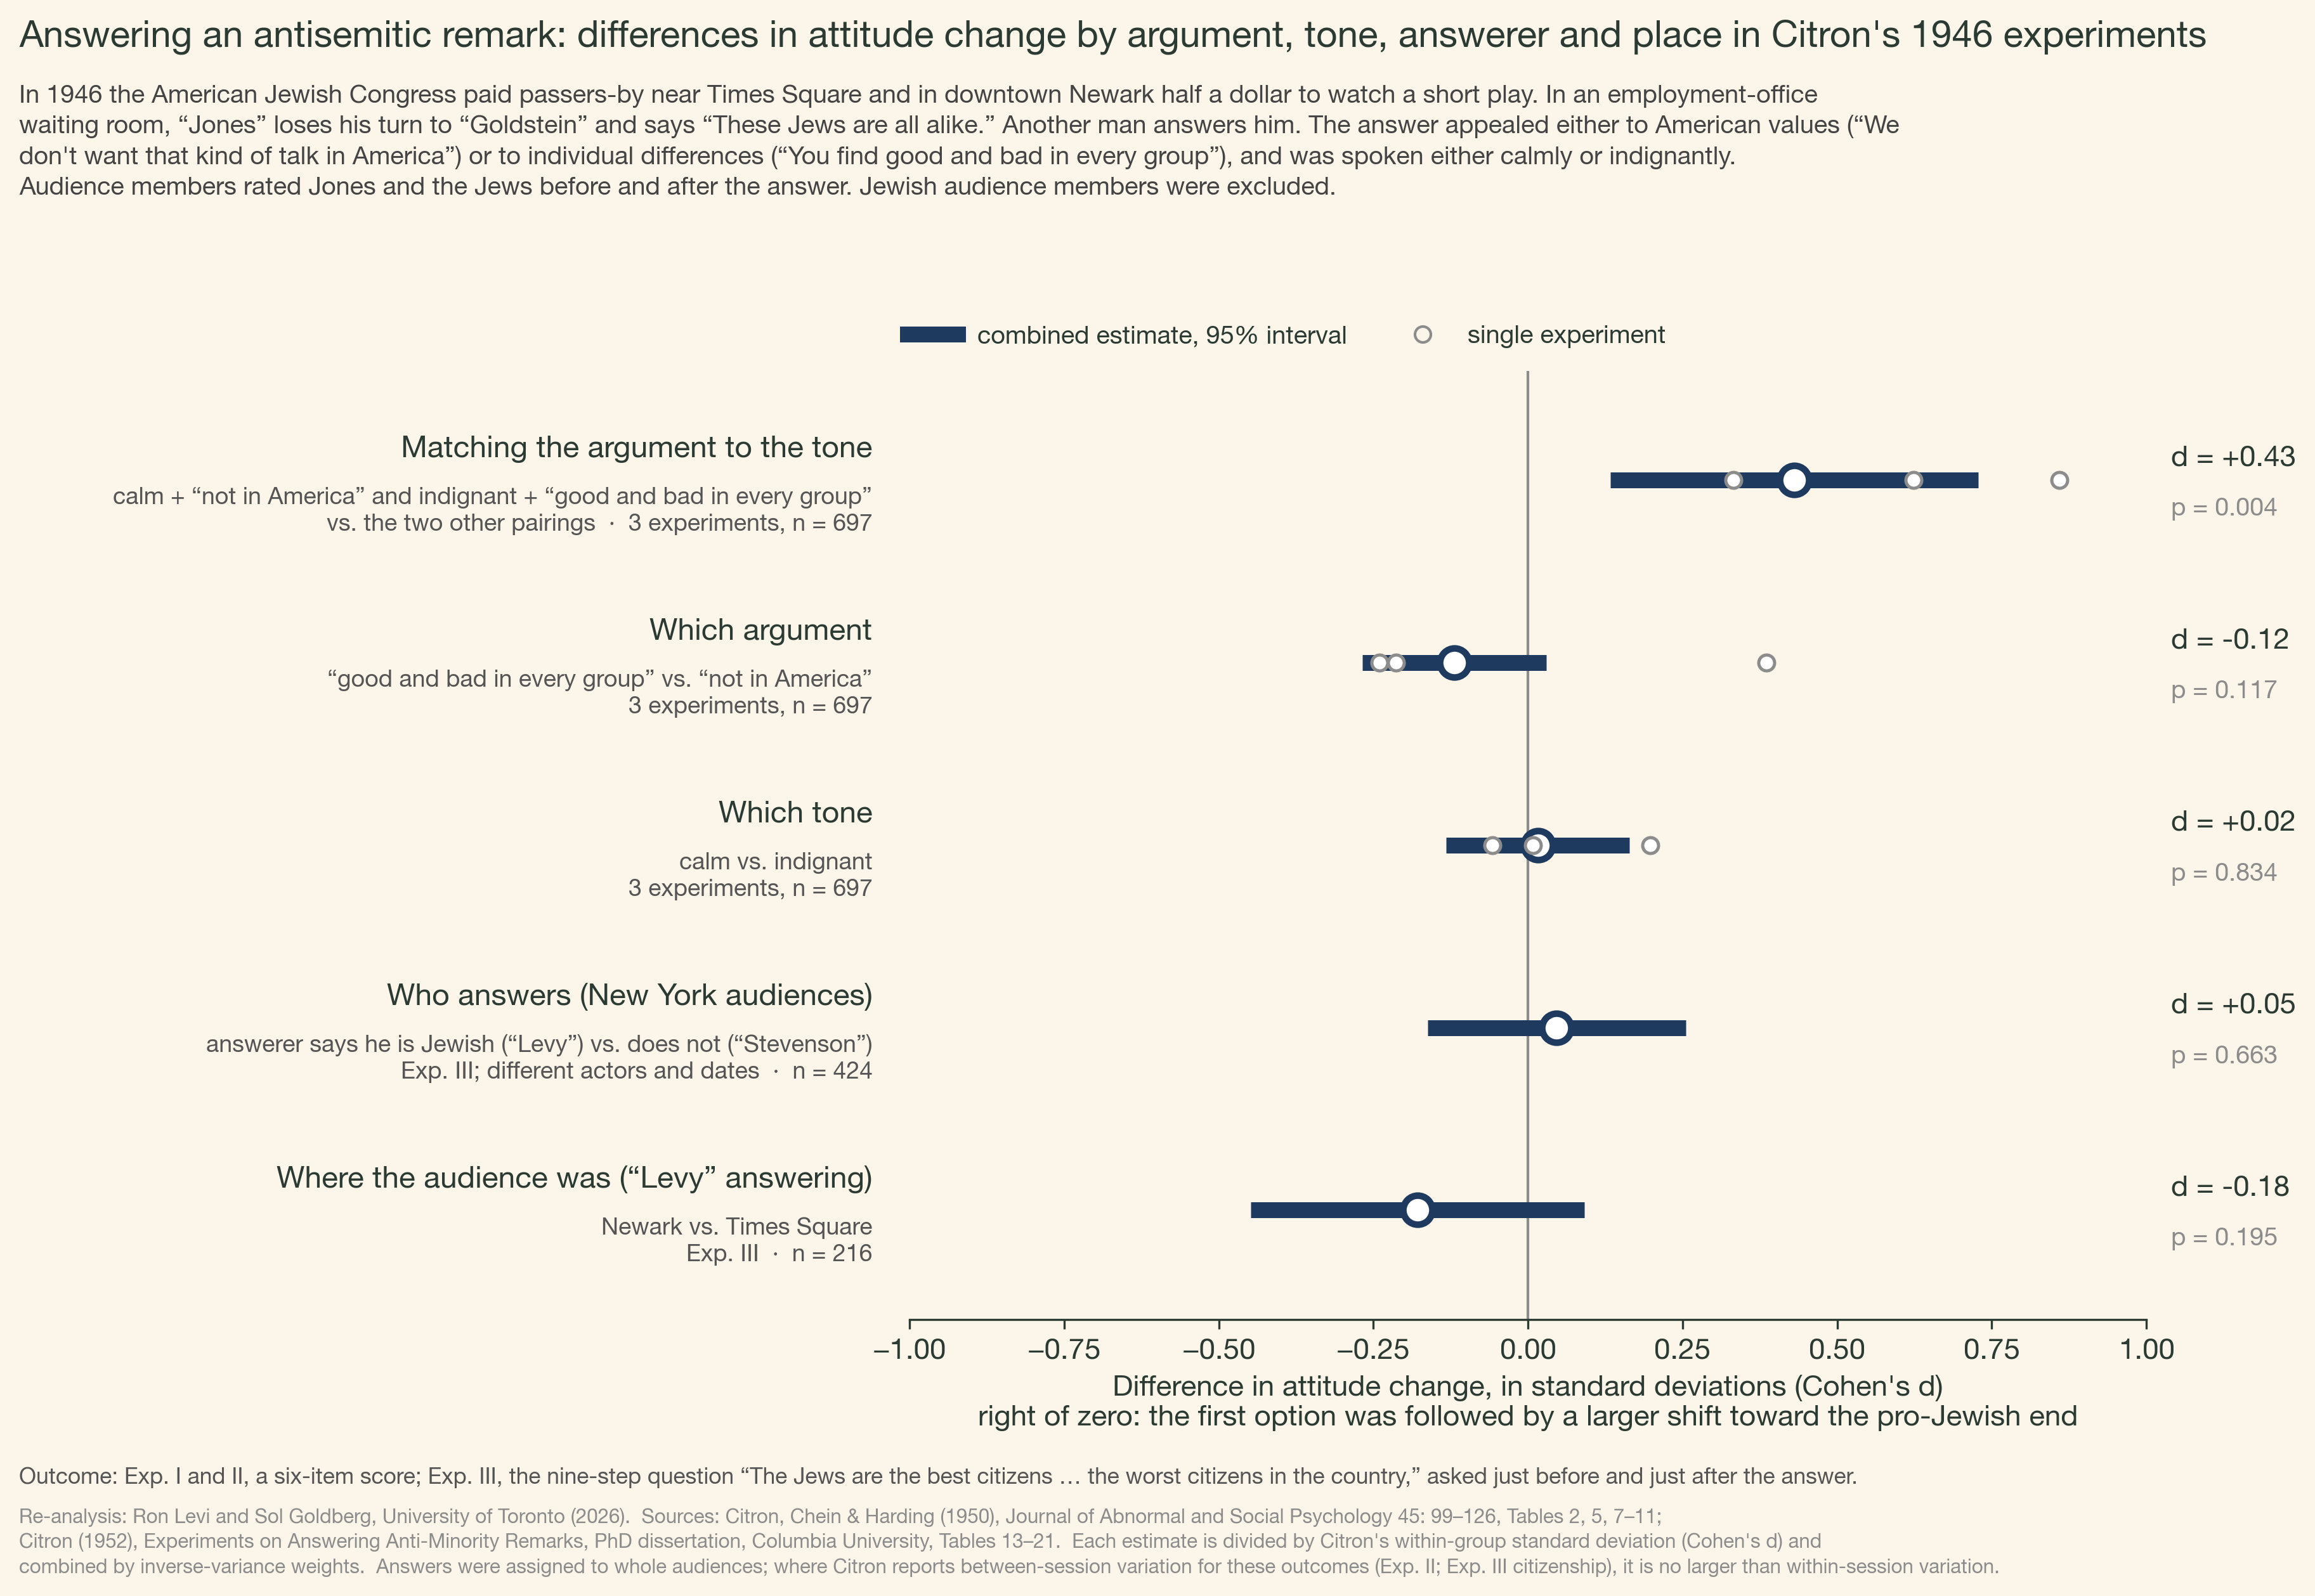
Neither the argument alone nor the tone alone was followed by a reliable difference across the three experiments. The pairing of the two was: calm with American values, and indignant with individual differences, were followed by more change than the two other pairings (d = +0.43, p = .004). This estimate depends on how the experiments' several outcomes are combined; the specification chart further down shows how much.
Picked as the better answer, and change, group by group
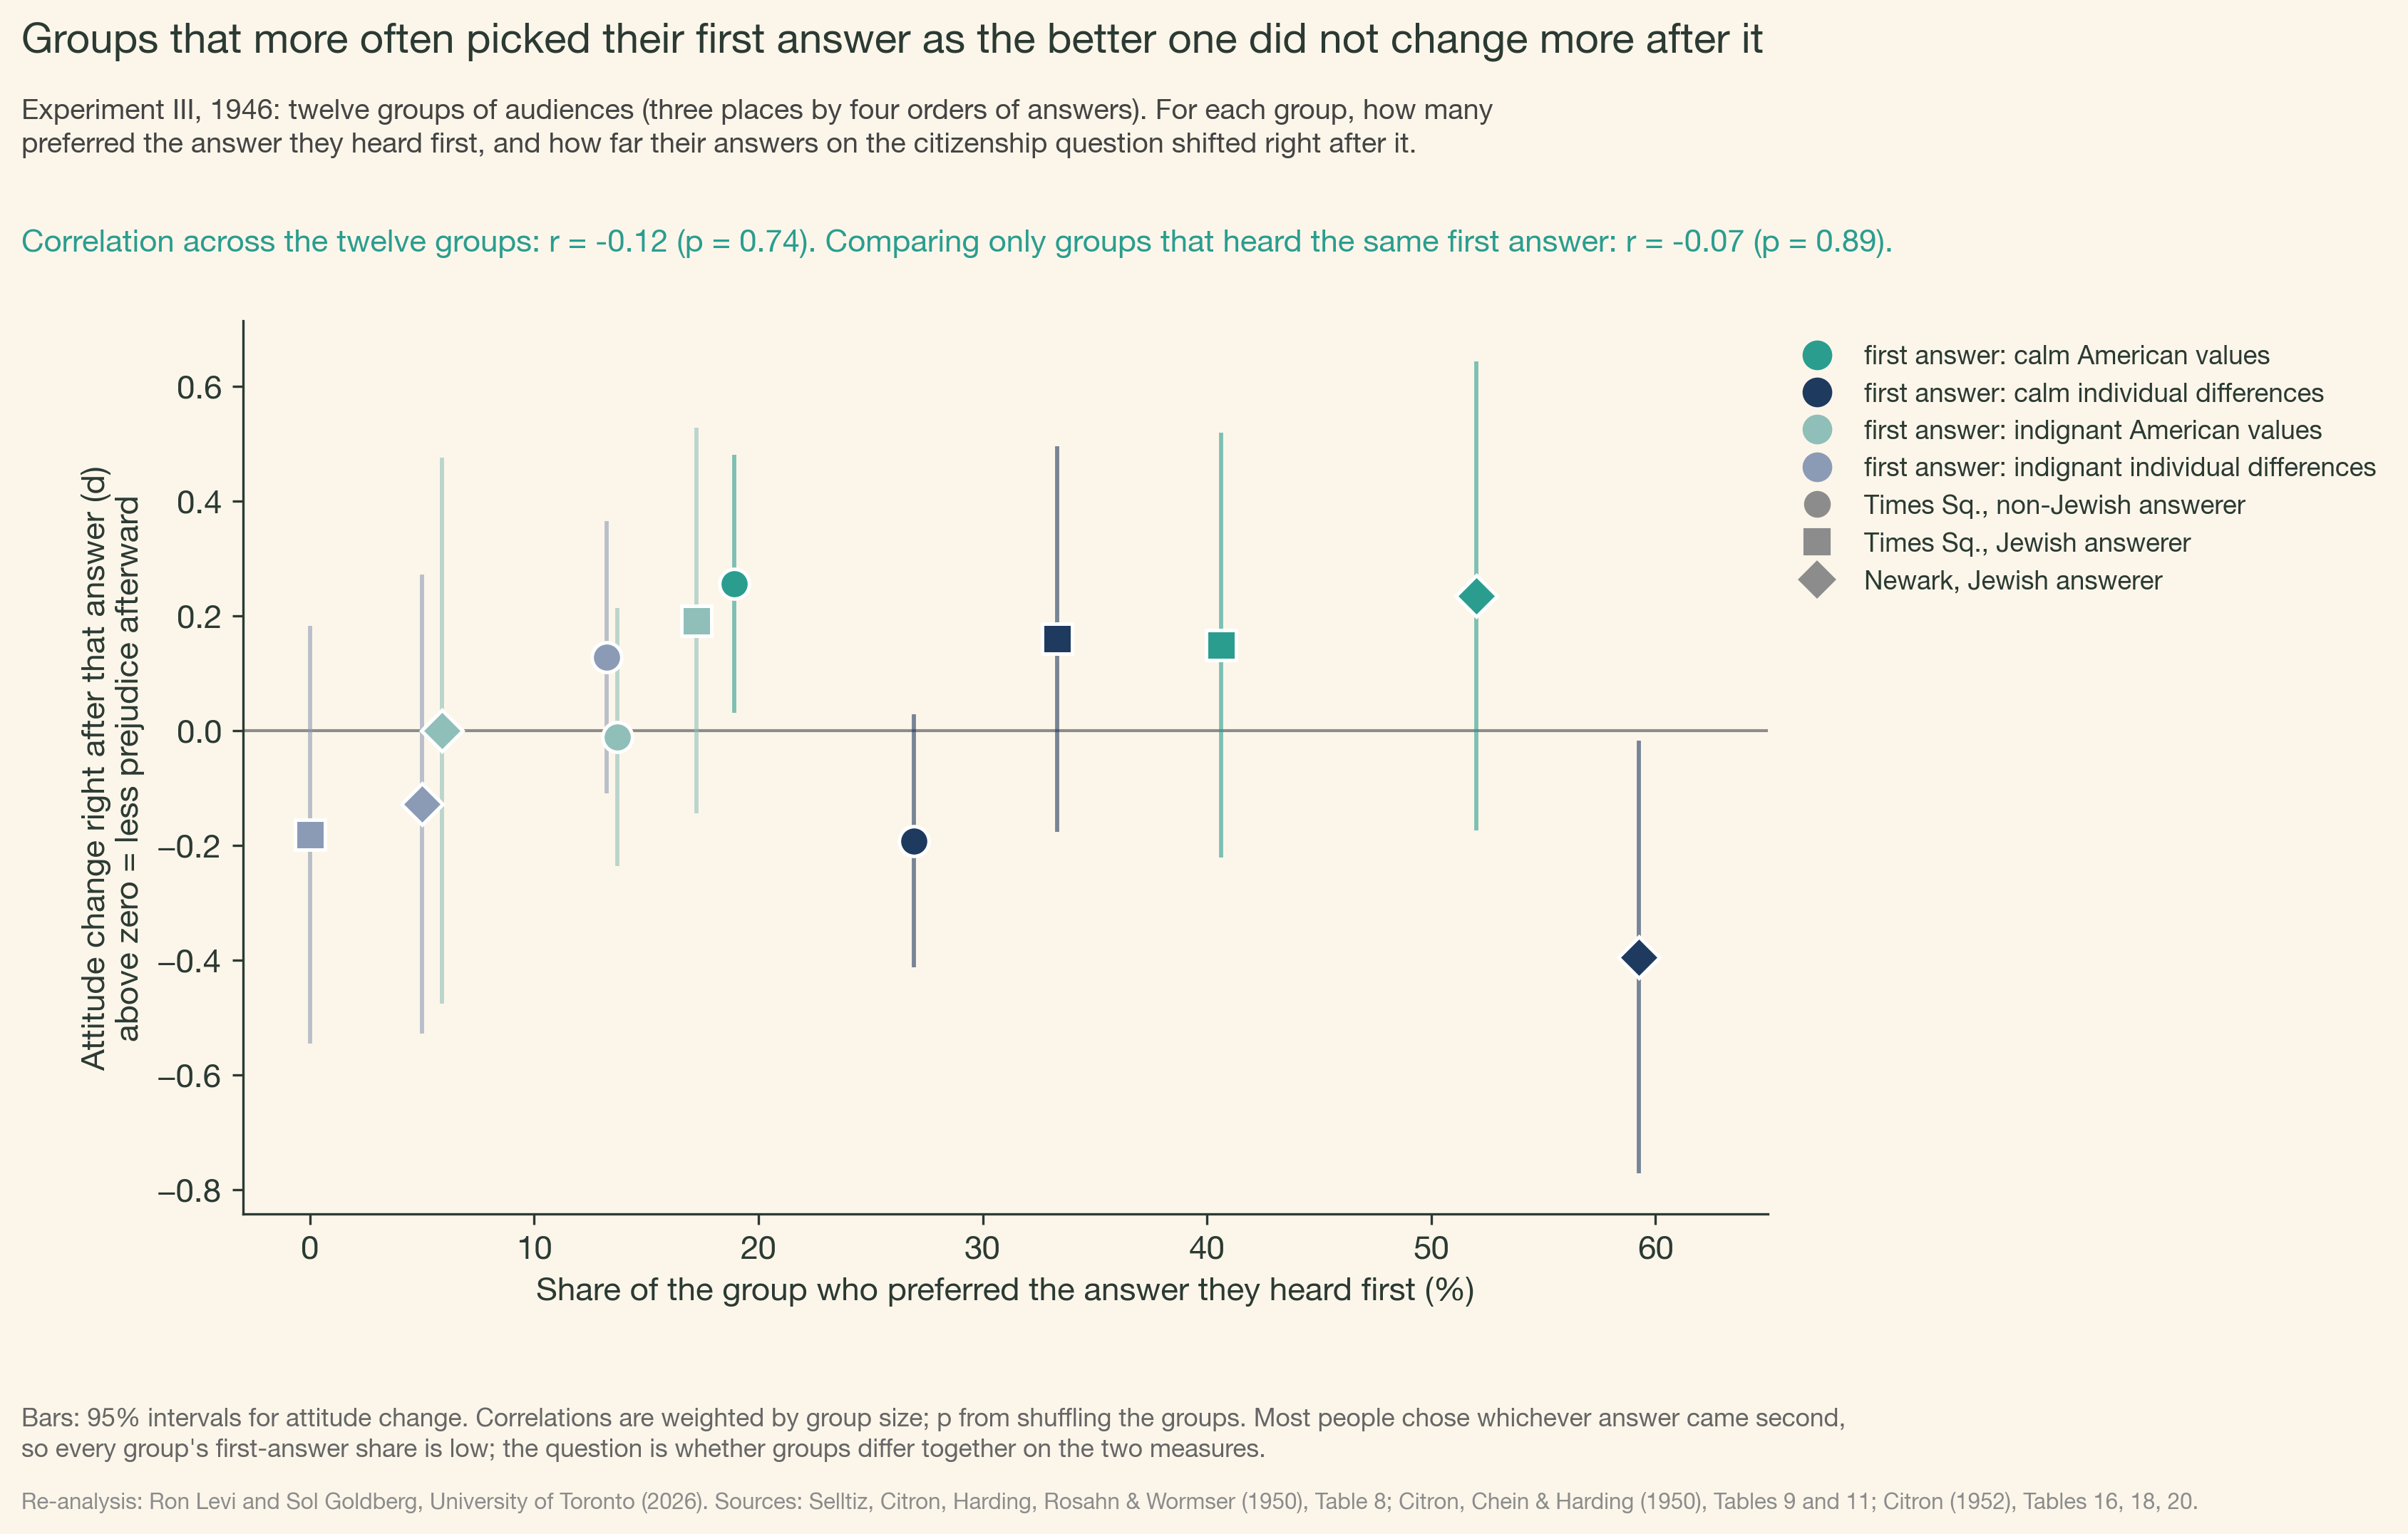
The Experiment III audiences fall into twelve groups: three places, each with four orders of answers. For each group the sources give how many people preferred the answer they heard first, and how far their answers on the citizenship question shifted right after it. Groups that more often picked their first answer as the better one did not shift more after it (r = −0.12, p = .74), and the same holds among groups that heard the same first answer.
Who gave the answer
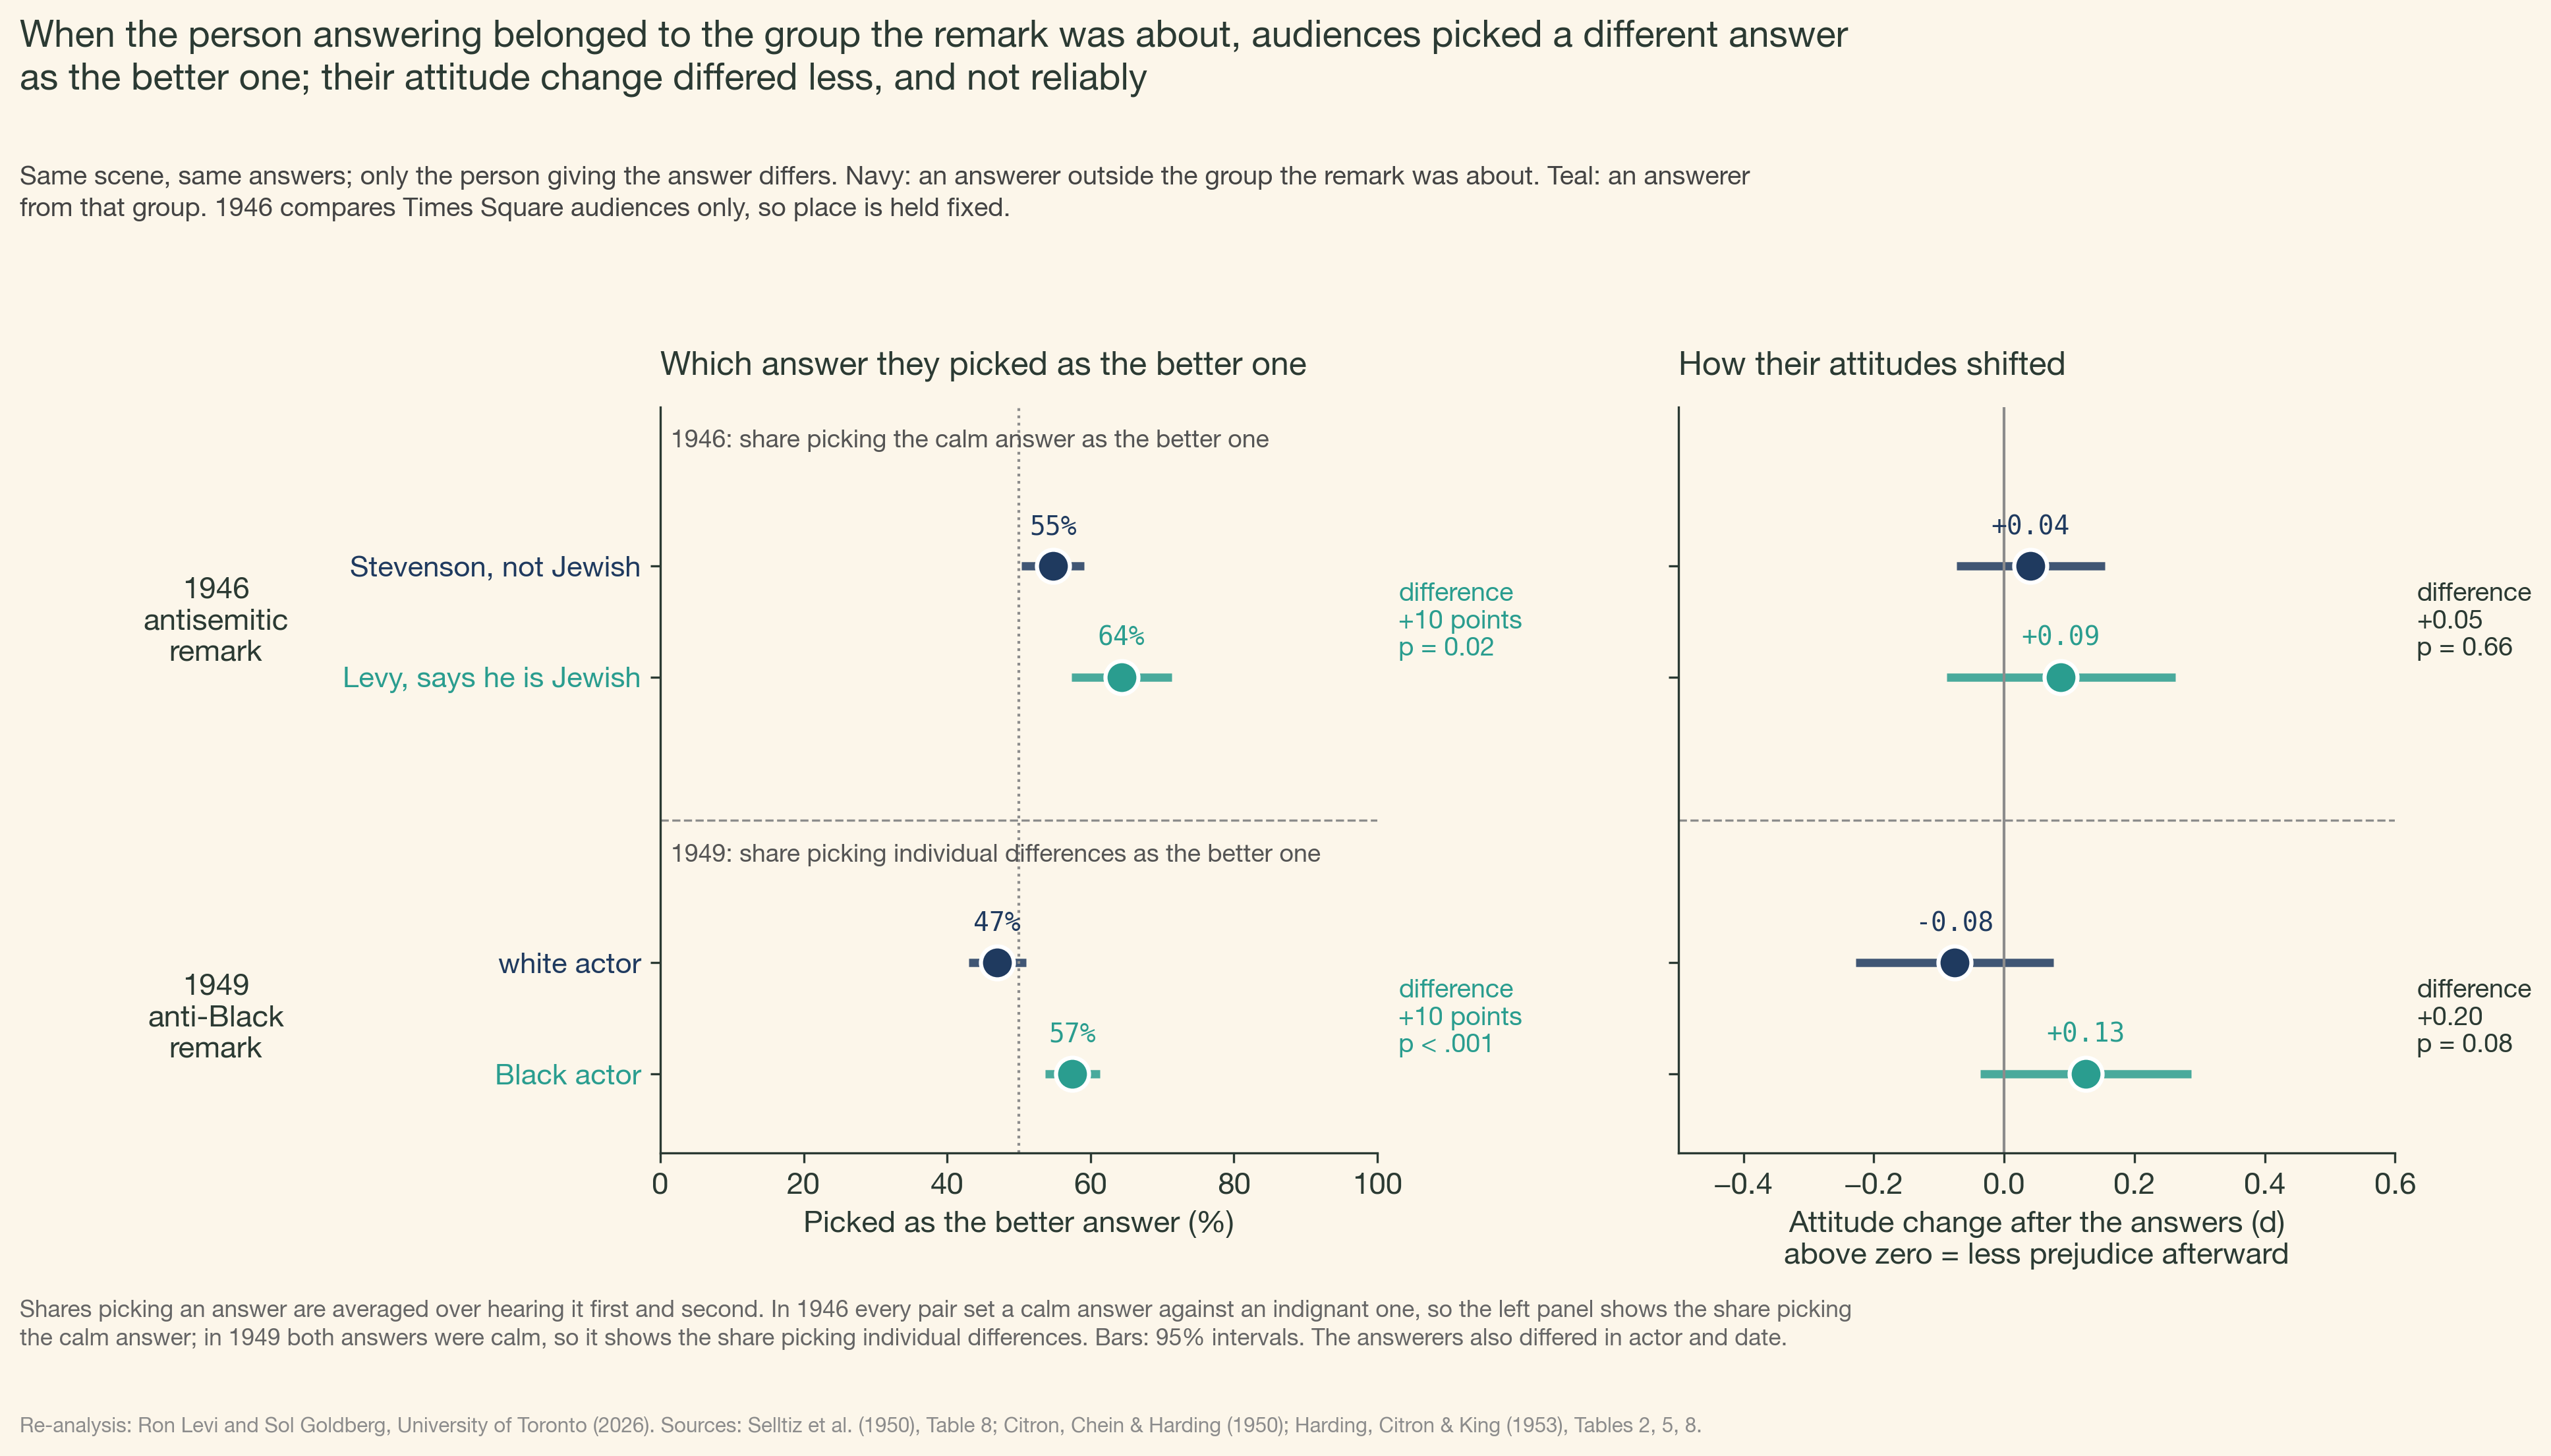
Both studies used an answerer from the group the remark was about and one from outside it. With the answerer from that group, audiences picked a different answer as the better one. In 1946, 10 percentage points more chose the calm answer when Levy, who says he is Jewish, gave it (p = .02, Times Square audiences only). In 1949, 10 points more chose individual differences when a Black actor gave it (p < .001). Attitude change differed less: +0.05 (p = .66) in 1946 and +0.20 (p = .08) in 1949. The answerers also differed in actor and date.
Who picked which argument as the better answer
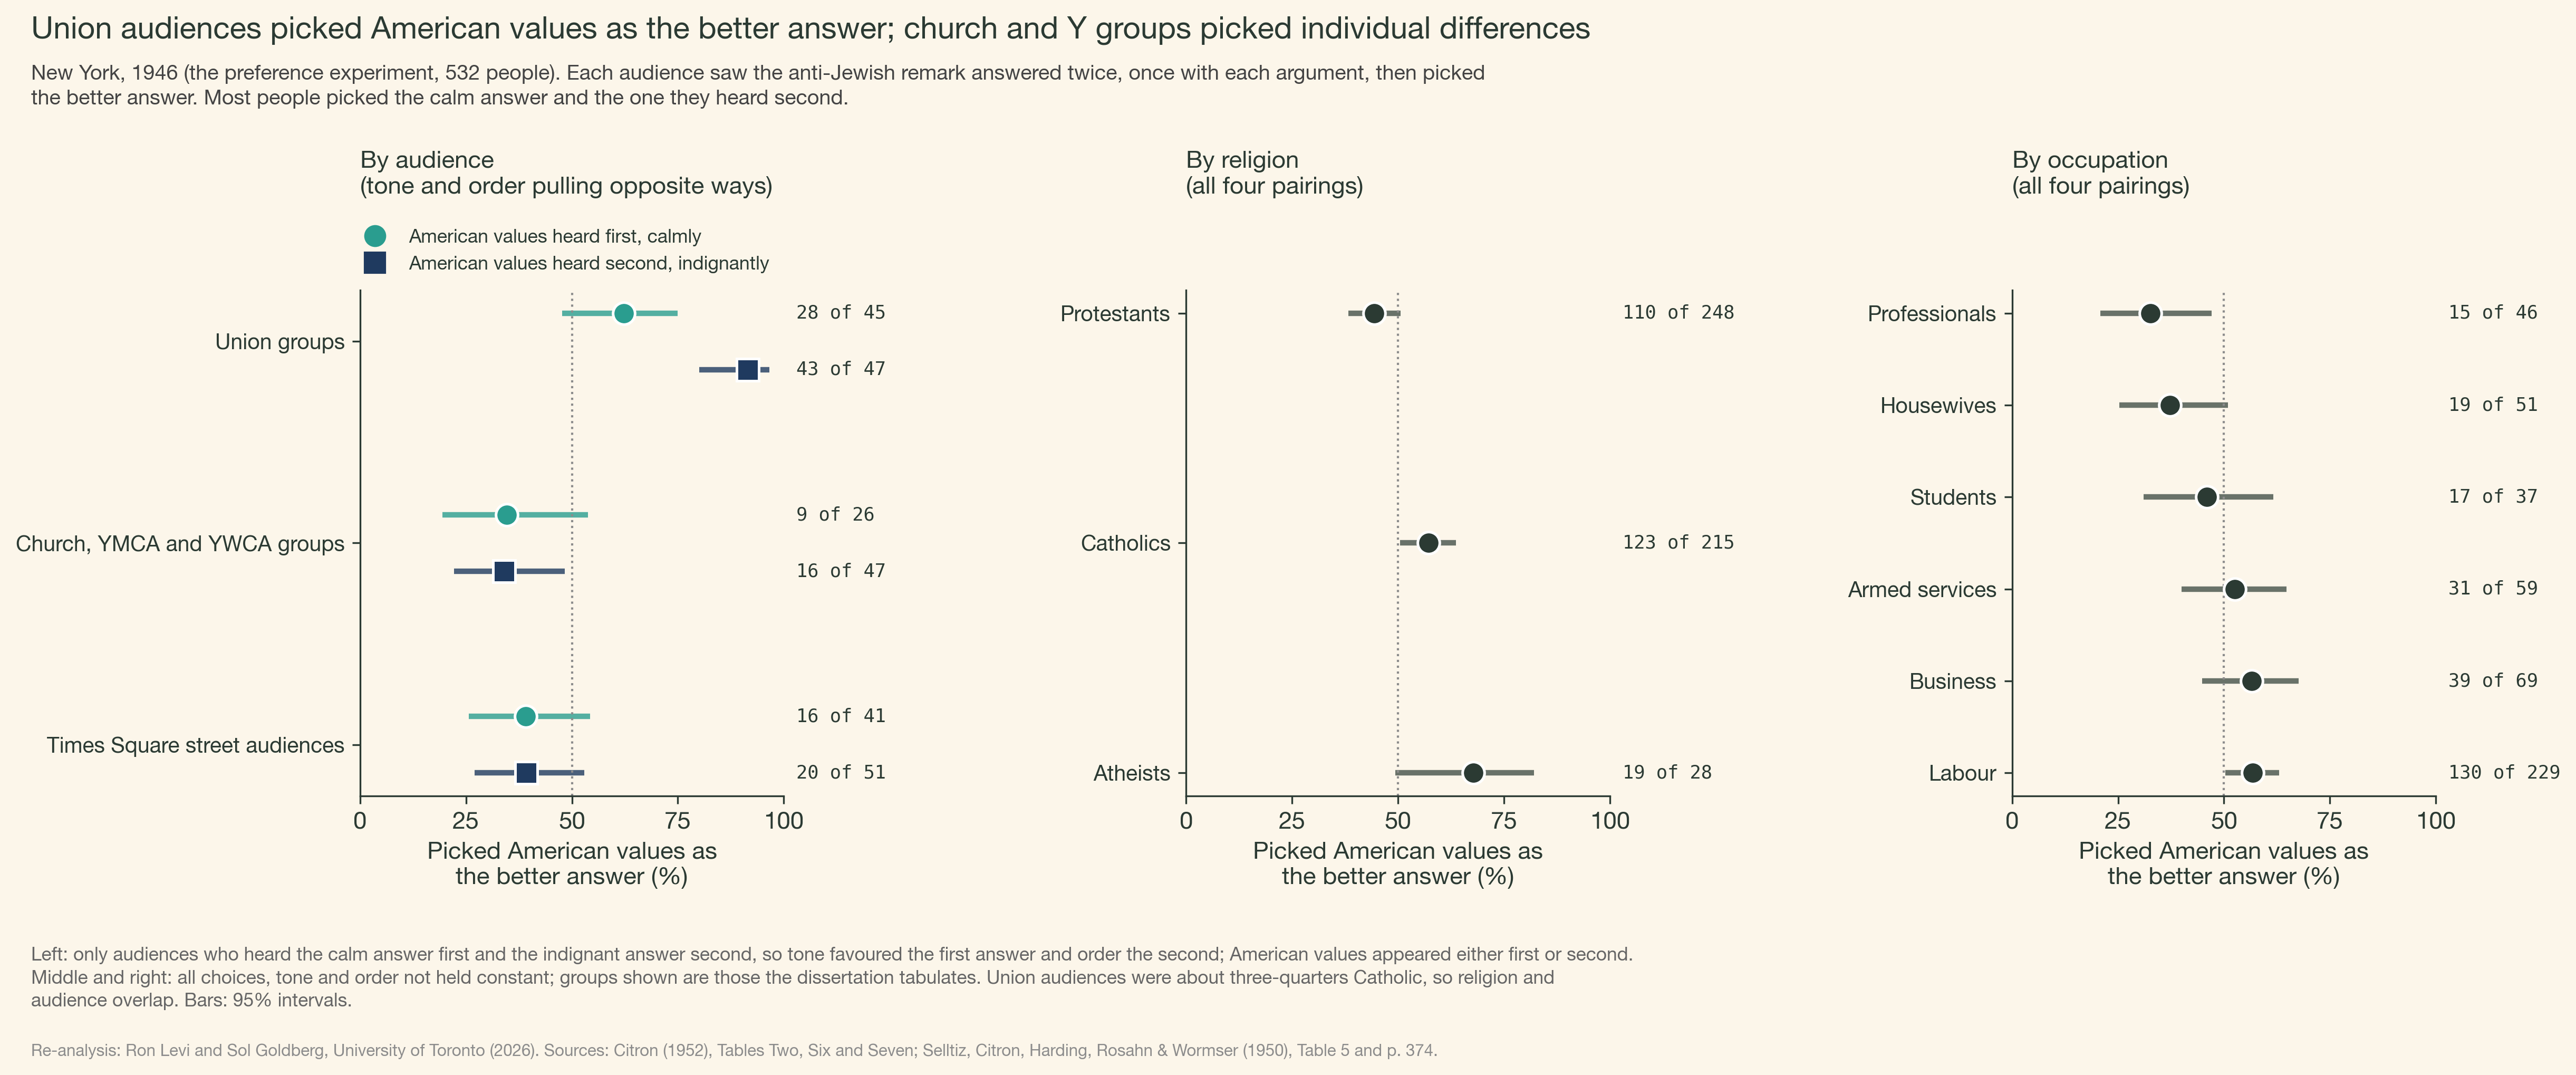
In the 1946 preference experiment, union audiences picked American values; church, YMCA and YWCA groups picked individual differences; street audiences leaned slightly to individual differences. The clearest comparison uses the audiences who heard the calm answer first and the indignant one second, so that tone and order pulled in opposite directions: union audiences picked American values 28 of 45 and 43 of 47 times, church and Y groups 9 of 26 and 16 of 47 times. Catholics, atheists, business people and labourers leaned to American values, and Protestants, professionals and housewives to individual differences, though these splits do not hold tone and order constant, and union audiences were about three-quarters Catholic.
The same comparison across every audience
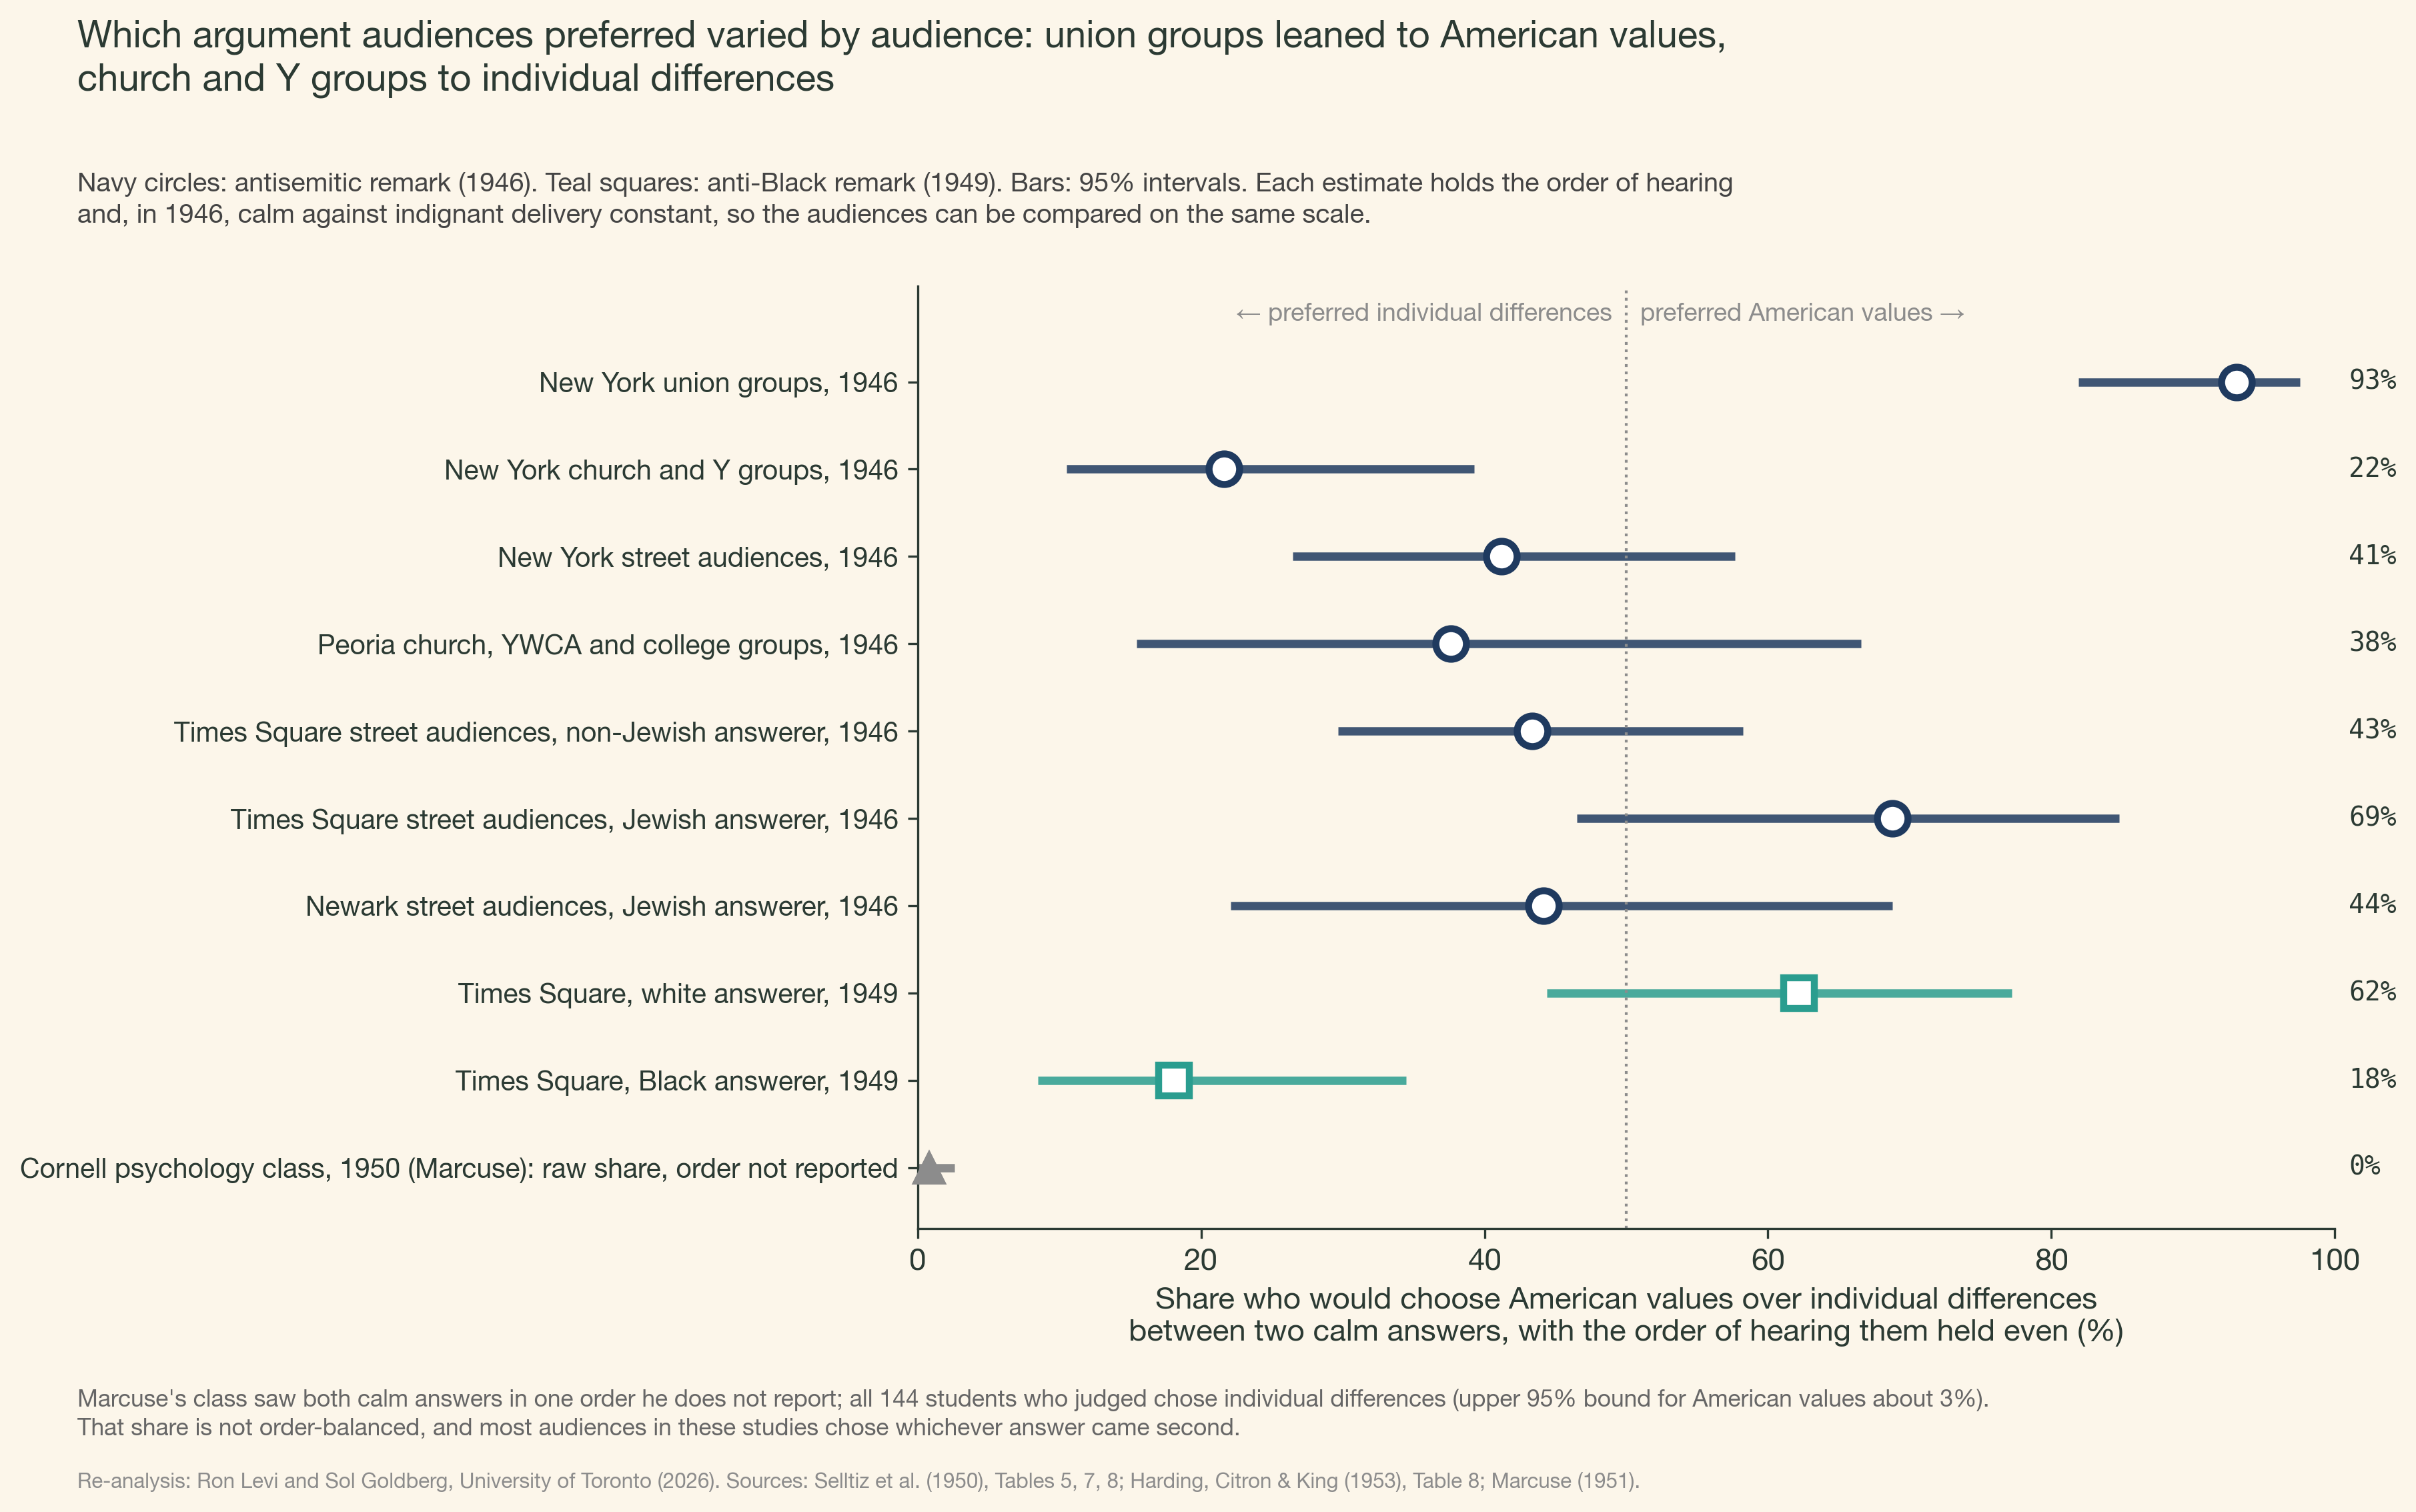
Holding the order of hearing and the tone of delivery constant, New York union groups would have chosen American values over individual differences about 93% of the time, and New York church and Y groups about 22%. Street audiences sat near the middle. In 1949, audiences who heard a Black actor chose individual differences far more often than audiences who heard a white one. Marcuse's Cornell class, which saw both calm answers in an order he does not report, chose individual differences unanimously.
The answer heard last
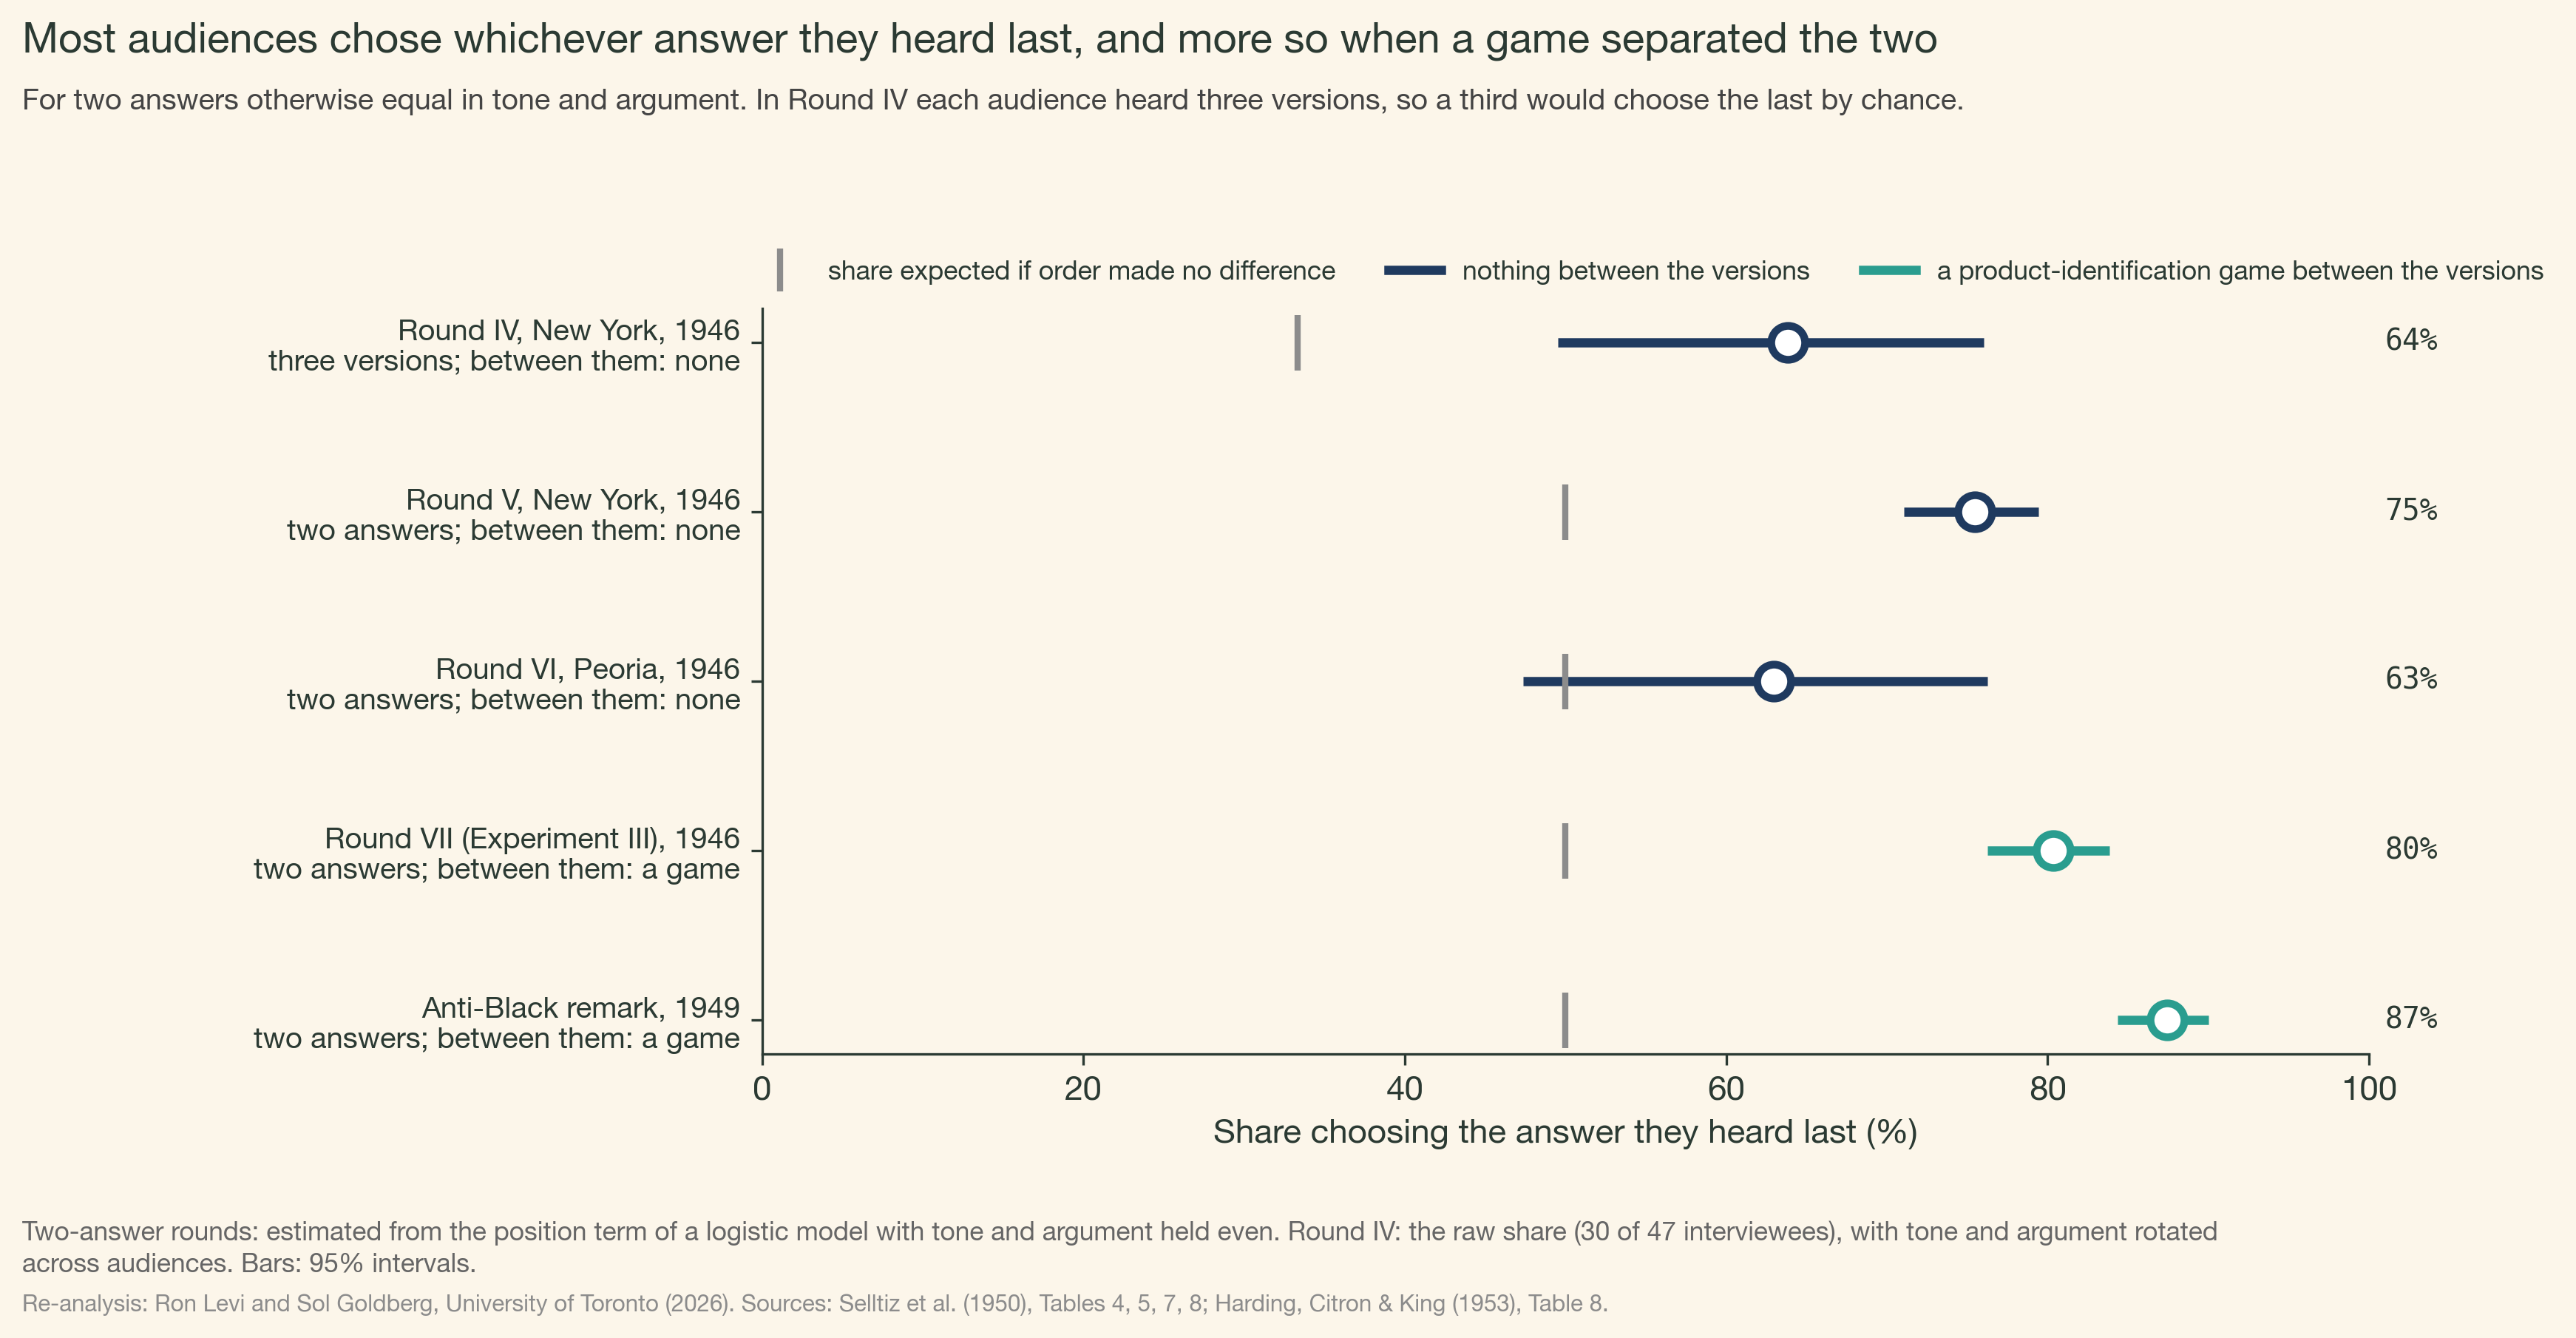
Every preference result here has to contend with order. Between 63% and 87% of audiences chose whichever answer they heard last, and the share was highest in the two studies where a short game separated the versions, which made the first answer harder to remember.
Who preferred saying nothing
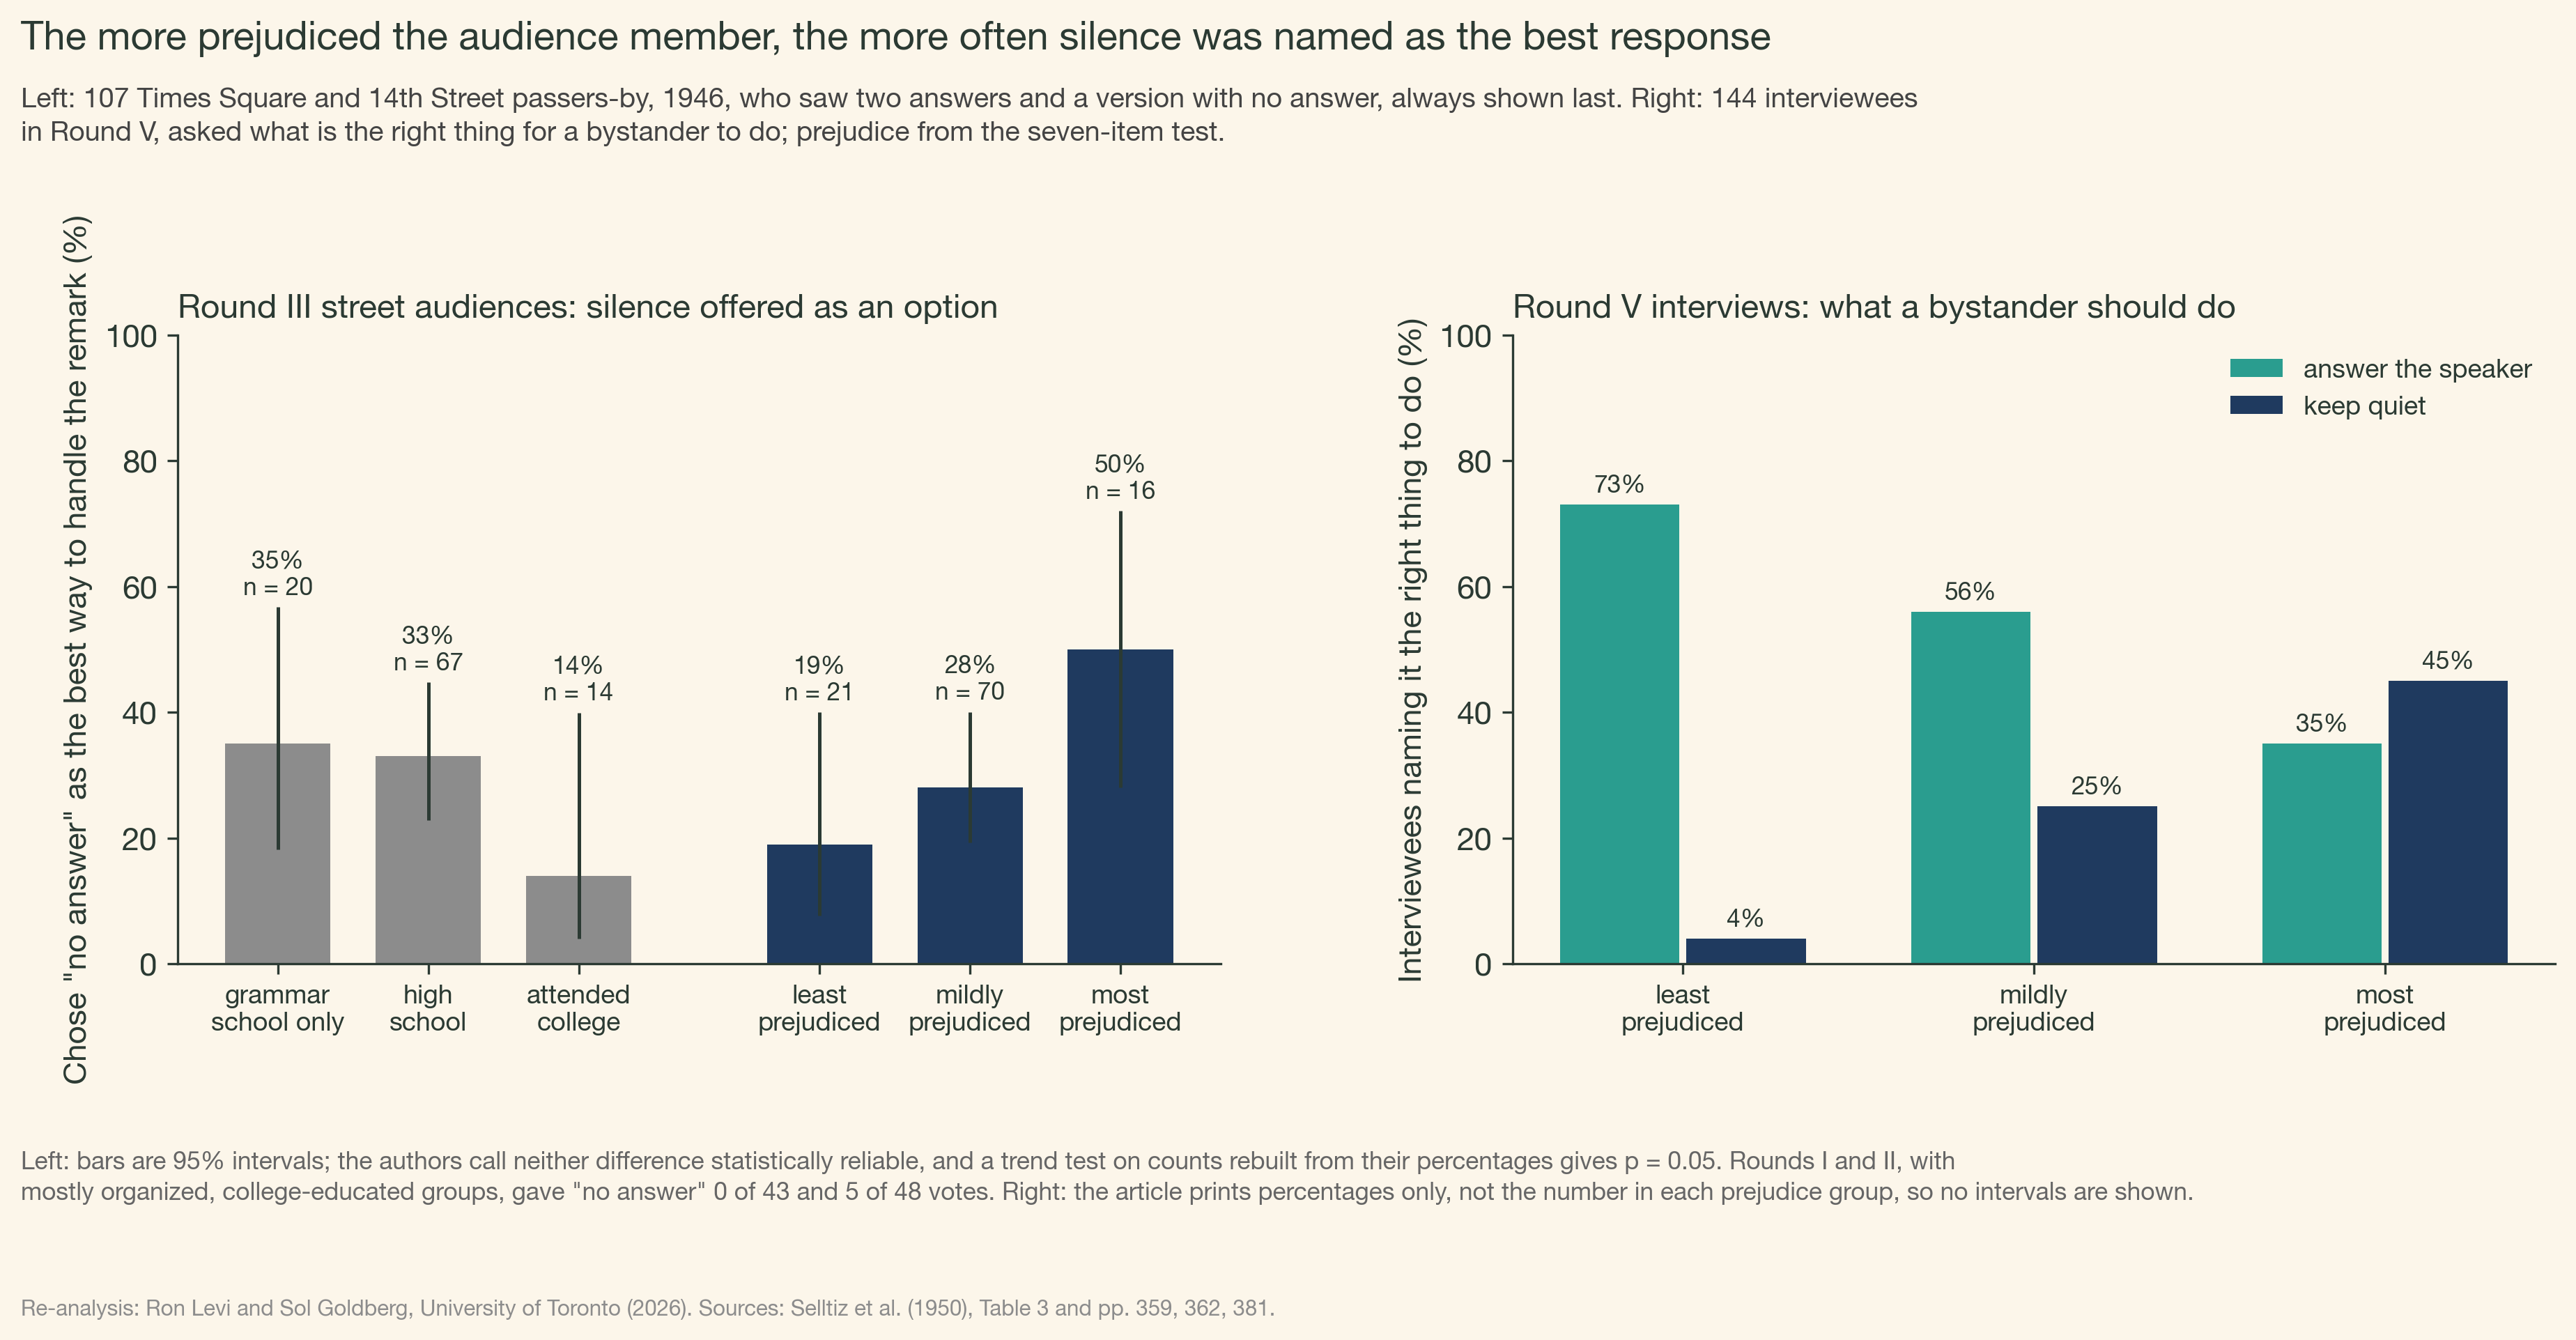
Only the pilot rounds offered "no answer" as an option. Among Times Square and 14th Street passers-by, 50% of the most prejudiced chose it as the best way to handle the remark, against 19% of the least prejudiced; the groups are small and the authors did not call the difference reliable. In the Round V interviews, 45% of the most prejudiced said the right thing for a bystander was to keep quiet, against 4% of the least prejudiced.
Three further checks
Audiences as the unit
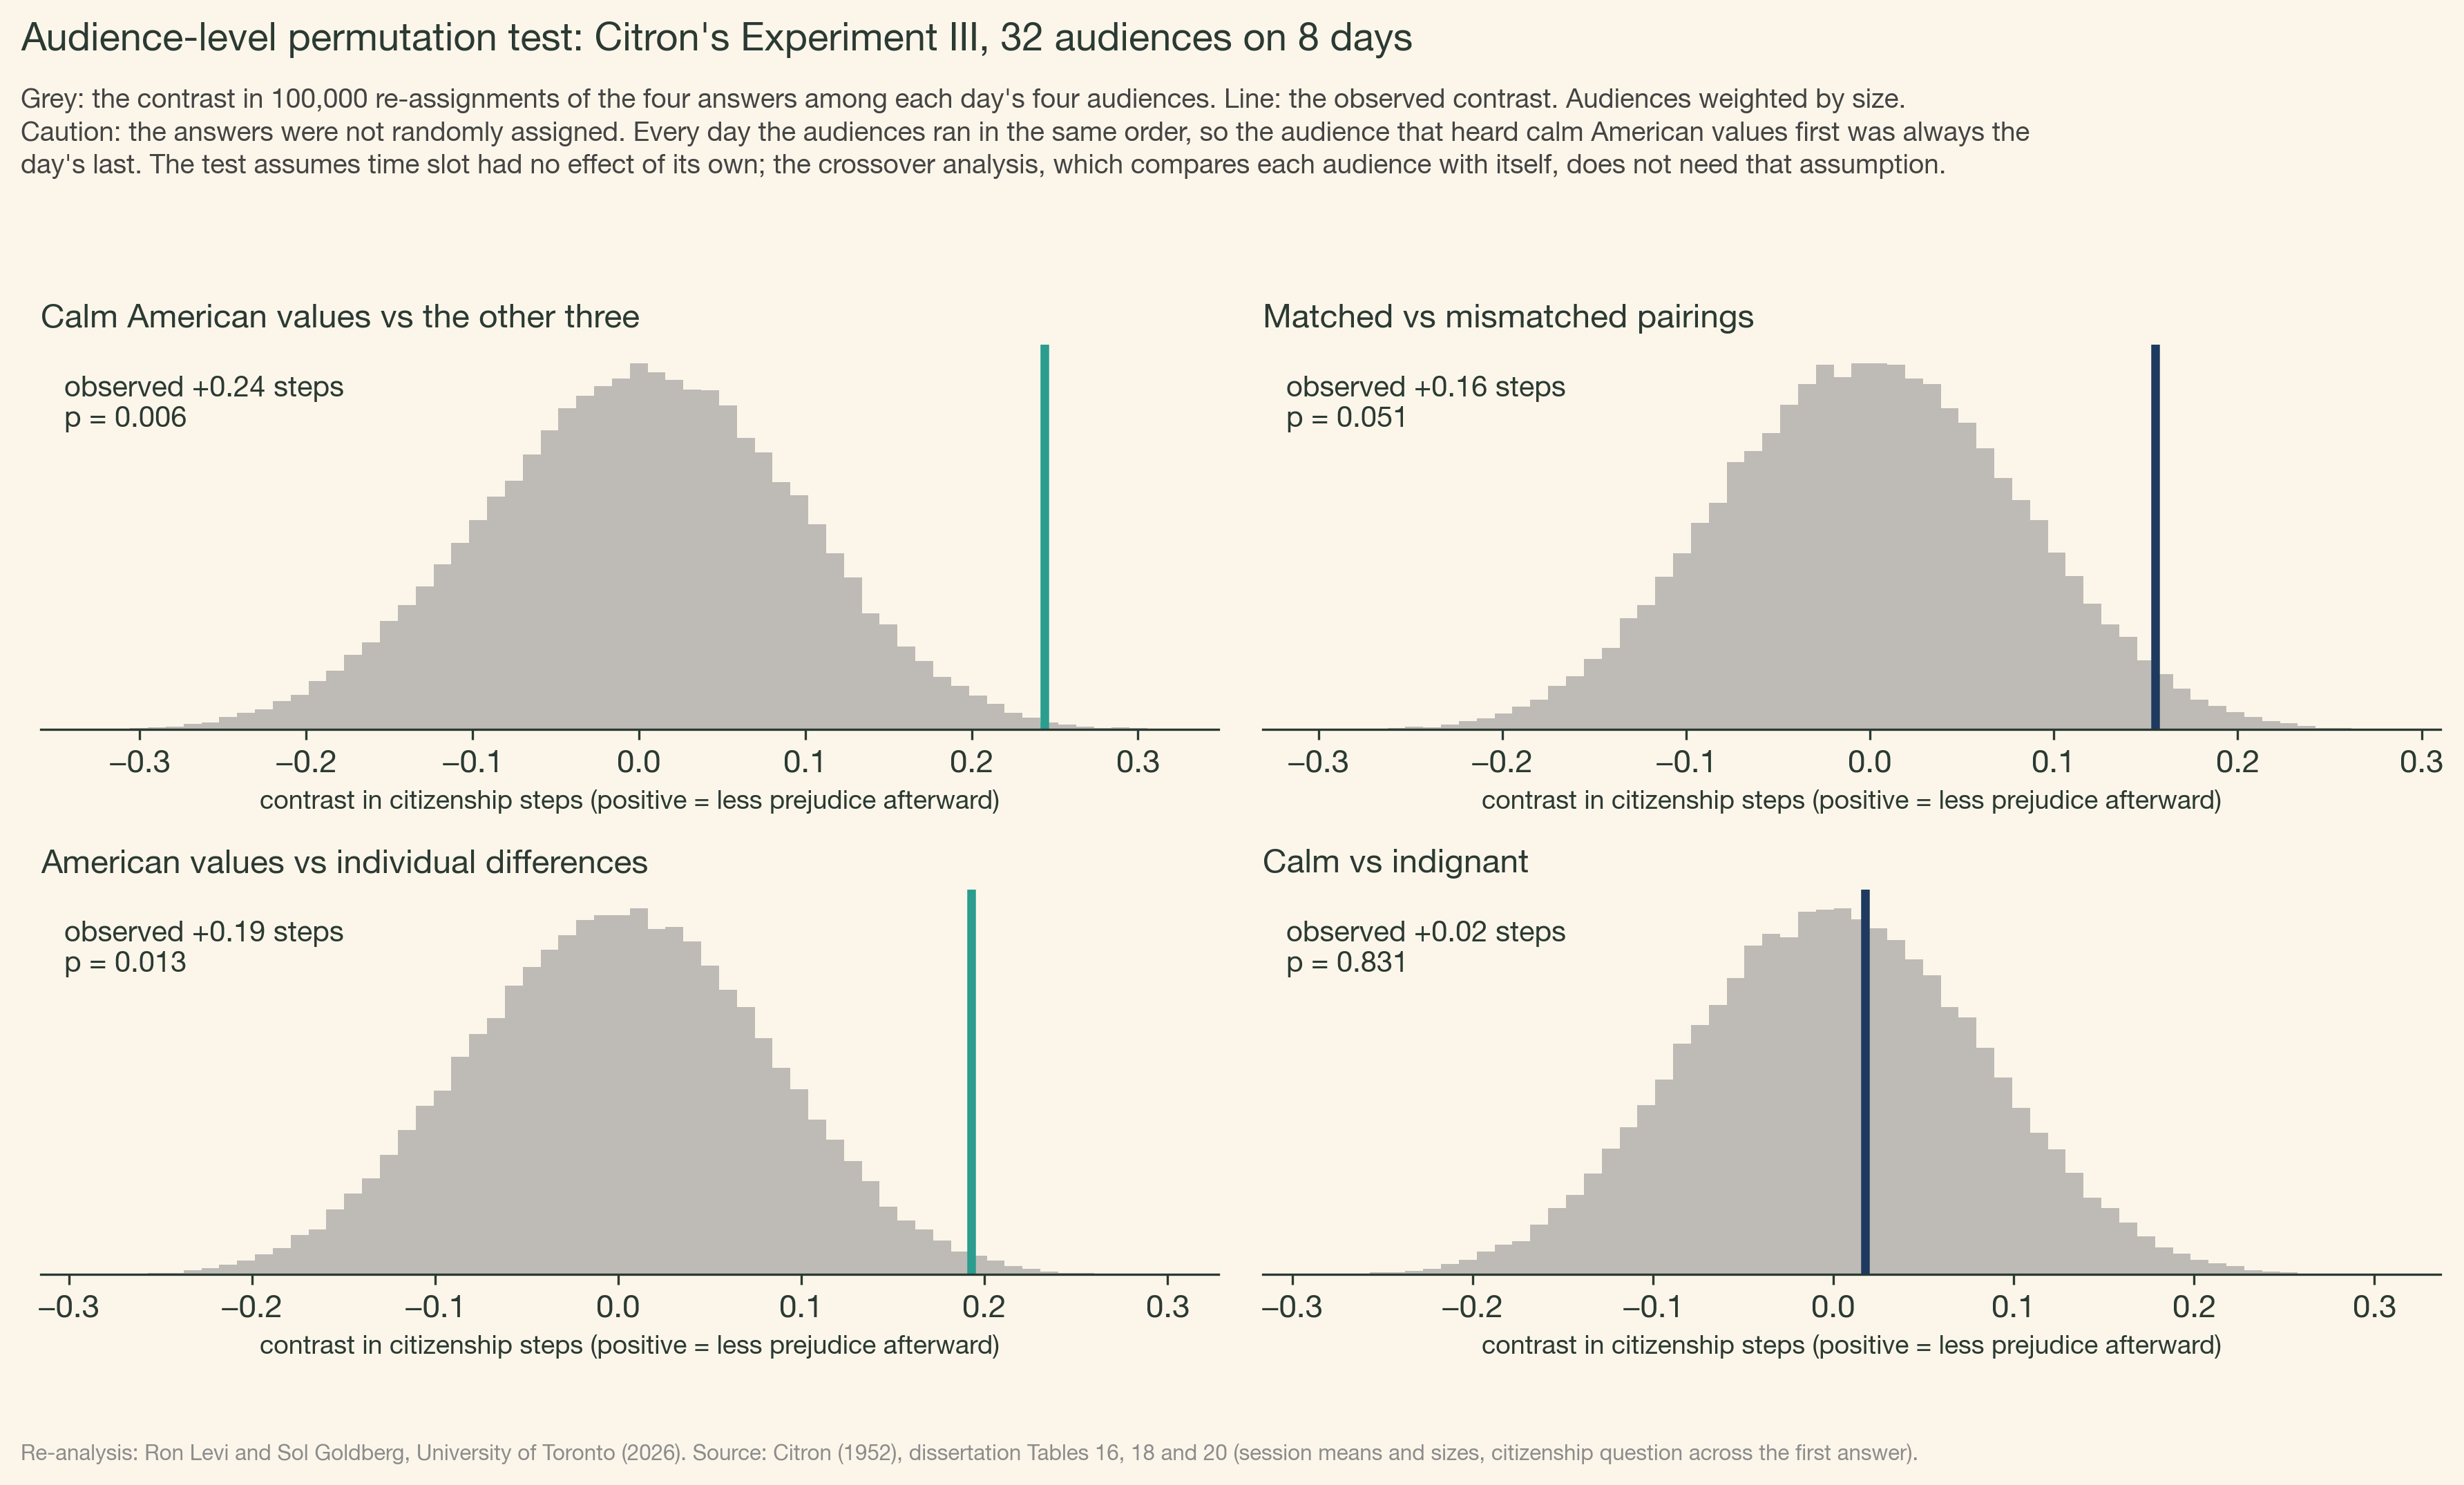
Answers were assigned to whole audiences, not to individuals. A permutation test that reshuffles the 32 Experiment III audiences finds the calm American-values audiences ahead of the other three (0.25 scale steps, p = .005). Every day ran its four audiences in the same order, so the calm American-values-first audience was always the day's last; the test assumes the time of day made no difference.
How many people shifted
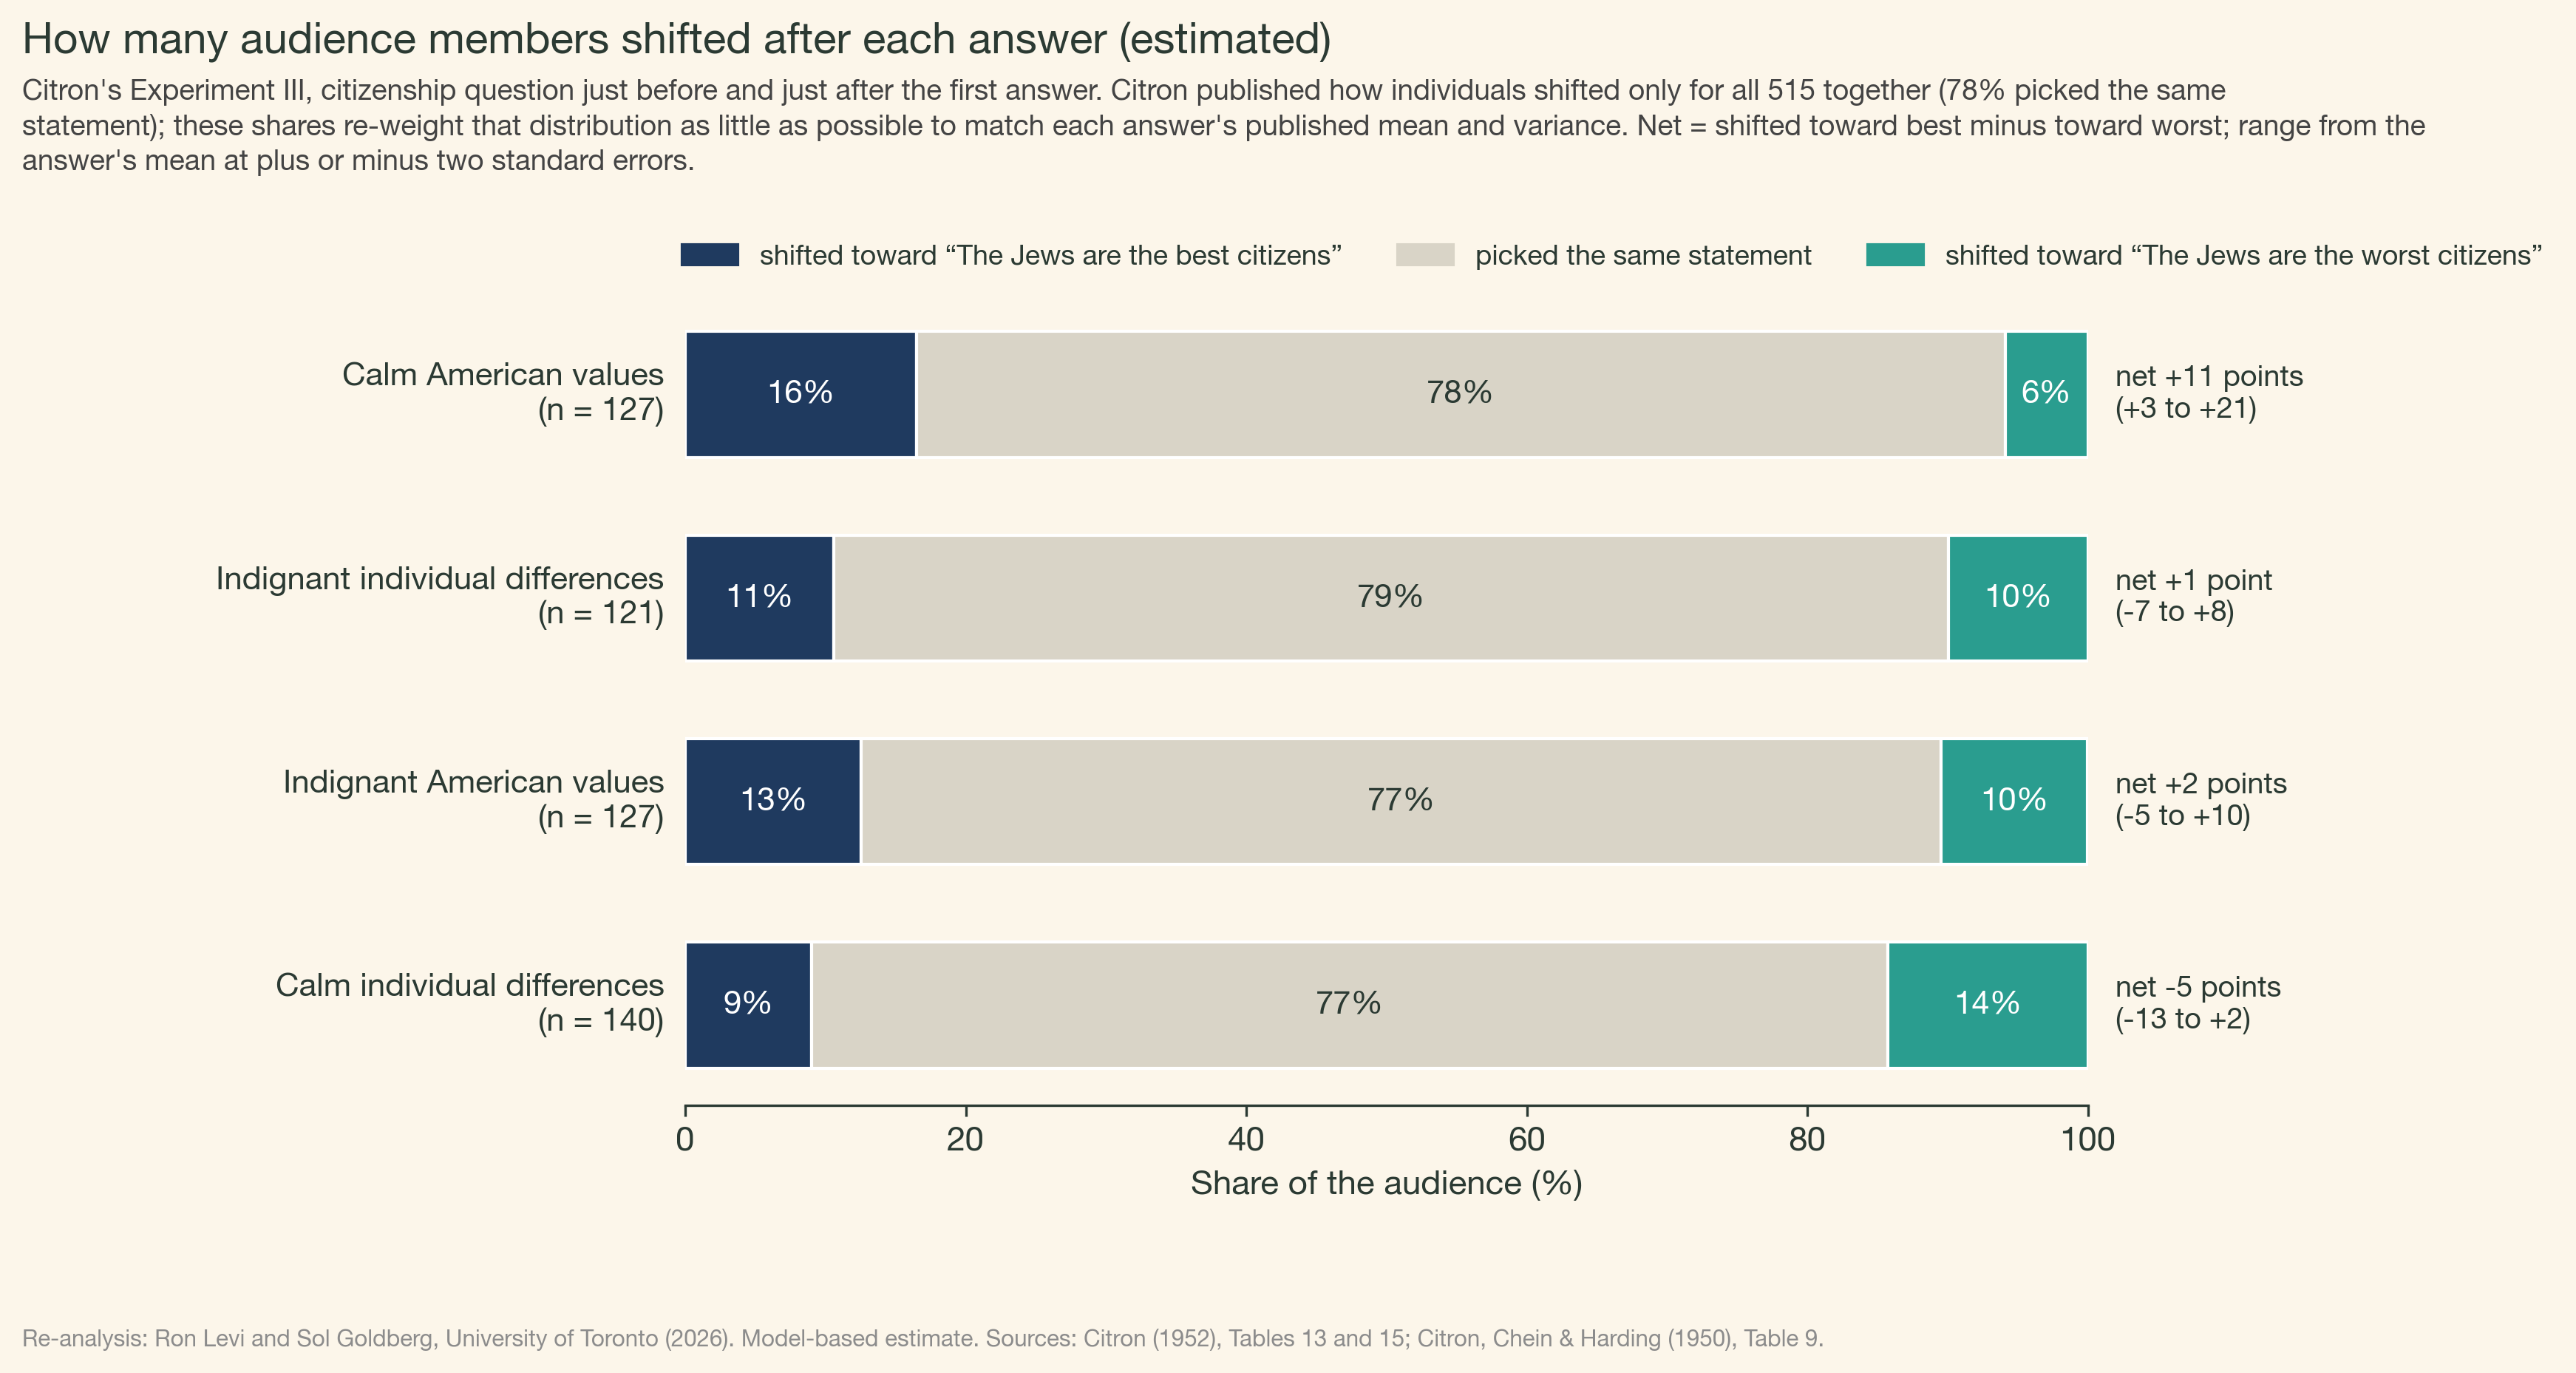
Most people gave the same answer before and after (401 of 515 in Experiment III). The authors published how individuals shifted only for everyone combined. A model that re-weights that distribution to match each answer's mean and variance estimates that after calm American values about 17% shifted toward "best citizens" and 6% toward "worst citizens". These shares are model-based estimates, not counts.
How much the choices matter
The experiments measured several outcomes, and some come from the same people. Depending on which outcomes are combined and how strongly they are assumed to be related, the p-value for the pairing of argument and tone runs from .004 to .36.